Business intelligence is a set of processes and solutions that help companies take leadership in this competitive business market. Organizations of any size and level can use BI tools to analyze, manage and visualize business data to improve their revenue.
By presenting your data in an easy-to-understand format, BI software helps you better understand your business’s strengths and weaknesses while providing you with actionable insights into KPIs and other important metrics.
What is Business Intelligence?
Business intelligence is a technology-driven process that predicts the historical, current, and future outlook of business operations. Business Intelligence works on data collected from a data warehouse or data mart and sometimes from operational data. The goal of business intelligence is to strengthen business decisions so that every action taken is beneficial to the business and ultimately make the Decision Support System (DSS) more accurate, precise and perfect.
The business intelligence process includes a variety of tools, applications, and methods. This includes data mining, online analytical processing, inquiries, reports, as well as risk analysis. These allow you to get relevant and reliable information to the right people, at the right time, with the aim of getting better and faster results.
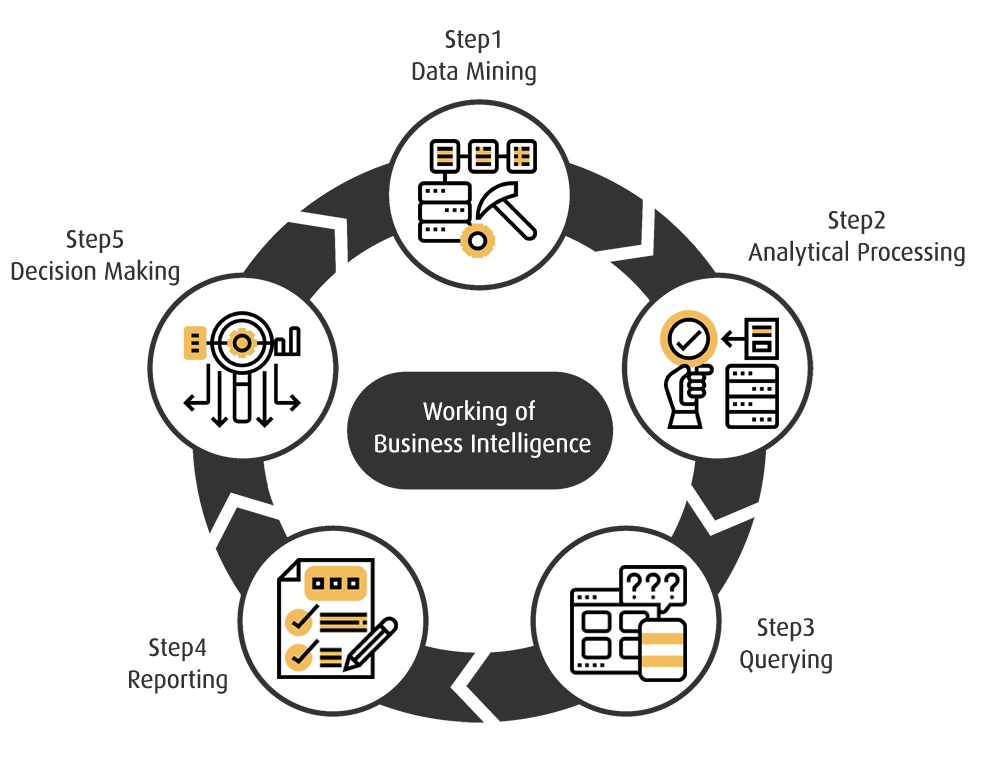
Working of Business Intelligence:

Business Intelligence is an analytical tool that collects and processes large amounts of unstructured data and provides output in the form of visualizations. Data visualization helps business leaders to see only the information they need to make informed business decisions.
Below are the steps of working of business intelligence:
Data Mining:
The process of converting raw data into full use of a business’s information. There is various software available that look for patterns in large batches of data so that they can learn more about the customers.
Analytical Processing:
Analytical processing in business intelligence involves the interaction between analysts and a collection of aggregated data that can be improved into alternative representational forms as a means of improved analytical performance.
Querying:
Querying in Business Intelligence is a request for information from a database. Today’s business intelligence systems enable business users to easily connect to and query data sources provisioned to them by their technical teams.
Reporting:
Reporting in business intelligence is the process of using a BI tool to prepare and analyze data to find and share actionable insights. Ultimately, it provides suggestions and observations about business trends, empowering decision-makers to act.
Decision Making:
The goal of using business intelligence solutions is to increase business productivity and improve decision making, thereby reducing risk. Business intelligence helps the user to make the best possible decisions, a way of thinking, a way of looking at the world, and a way of arriving at what you believe in.
Benefits of Business Intelligence
Enhance Business Productivity
With the help of Business Intelligence, you can take full advantage of essential insights accumulated from analyzing, organizing, reporting and collecting business data. With BI tools, you can reach all of your quantitative goals, such as monthly sales or on-time delivery targets, and track the progress of your business on a daily basis.
Fast, smarter and accurate reporting
Employees can use templates or customized reports to monitor KPIs using a variety of data sources, including financial, operations and sales data. These reports are generated in real-time and use the most relevant data to help businesses get to work faster. Most reports include easy-to-read visualizations such as graphs, tables, and charts. Some BI software reports are interactive so that users can play with different variables or access the information even faster.
Competitive analysis
With business intelligence, the user gets the ability to collect, analyze and use aggregated information on competitors, customers, and other market factors that contribute to a business’s competitive advantage. Competitive intelligence is important as it helps businesses understand their competitive environment and the opportunities and challenges, they present.
Improve growth patterns
BI helps companies gain a competitive edge by helping them discover new opportunities and develop better strategies. With the help of all the data, you can identify the market trends and help in improving the profit margin for the company. By analyzing the data, new sales trends can be identified by leveraging data from internal and external markets.
Increased customer satisfaction
BI software can help companies understand customer behavior and patterns. Most companies are taking customer feedback in real time and this information can help businesses retain customers and reach new ones. These tools can also help companies identify buying patterns, which help improve the customer experience to anticipate employee needs and provide better service.
Identifying market trends and patterns
Identifying new opportunities and building a strategy with supporting data can give businesses a competitive edge, directly impact long-term profitability, and give the full scope of what’s happening. Employees can leverage external market data along with internal data to detect new sales trends to analyze customer data and market conditions, as well as to detect business problems.
Increased revenue
Increasing revenue is an important goal for any business. Business intelligence tools help your company improve its customer retention rates, generate higher revenue from sales campaigns, and help keep your sales analysis current.
Business Intelligence dashboard examples
Sales Dashboard example
The EzInsights Sales Dashboard provides an at-a-glance view of your sales team’s performance. It allows C-level executives and managers to easily control and monitor sales KPIs on a single screen. Meanwhile, it also helps sales teams to reach sales targets and sales goals through detailed analysis of sales performance, cycle length and sales funnel.

Marketing Dashboard Example
The EzInsights Marketing Dashboard allows the marketing team to view marketing metrics, KPIs and analytics using data visualizations. It also helps marketers to evaluate the performance and progress of their campaigns in real time, and hence potentially saving your marketing department a lot of time and money.

Human Resources Dashboard example
EzInsights helps the HR team to track, analyze and report HR KPIs. It also helps the HR department to improve recruitment processes, optimize workplace management as well as enhance overall employee performance.

Summary
In every business, managers have to make informed decisions for better business performance, with EzInsight AI business analysis tool you can easily get all the necessary accessories to make this happen.
If you’re ready to start using EzInsights and its features, try our BI reporting tool for a free trial

Milan Desai
Chief Technology Officer
Milan Desai has more than 20 years of industry experience in working with clients to solve business problems. Passionate about leveraging technology for improving the quality of life and optimize the use of resources. Currently, working on utilizing data to drive business decision making process and user understanding of key metrics that drive the organization and markets in general. Co-founder of EzDataMunch – the first BI Apps store in the world.

