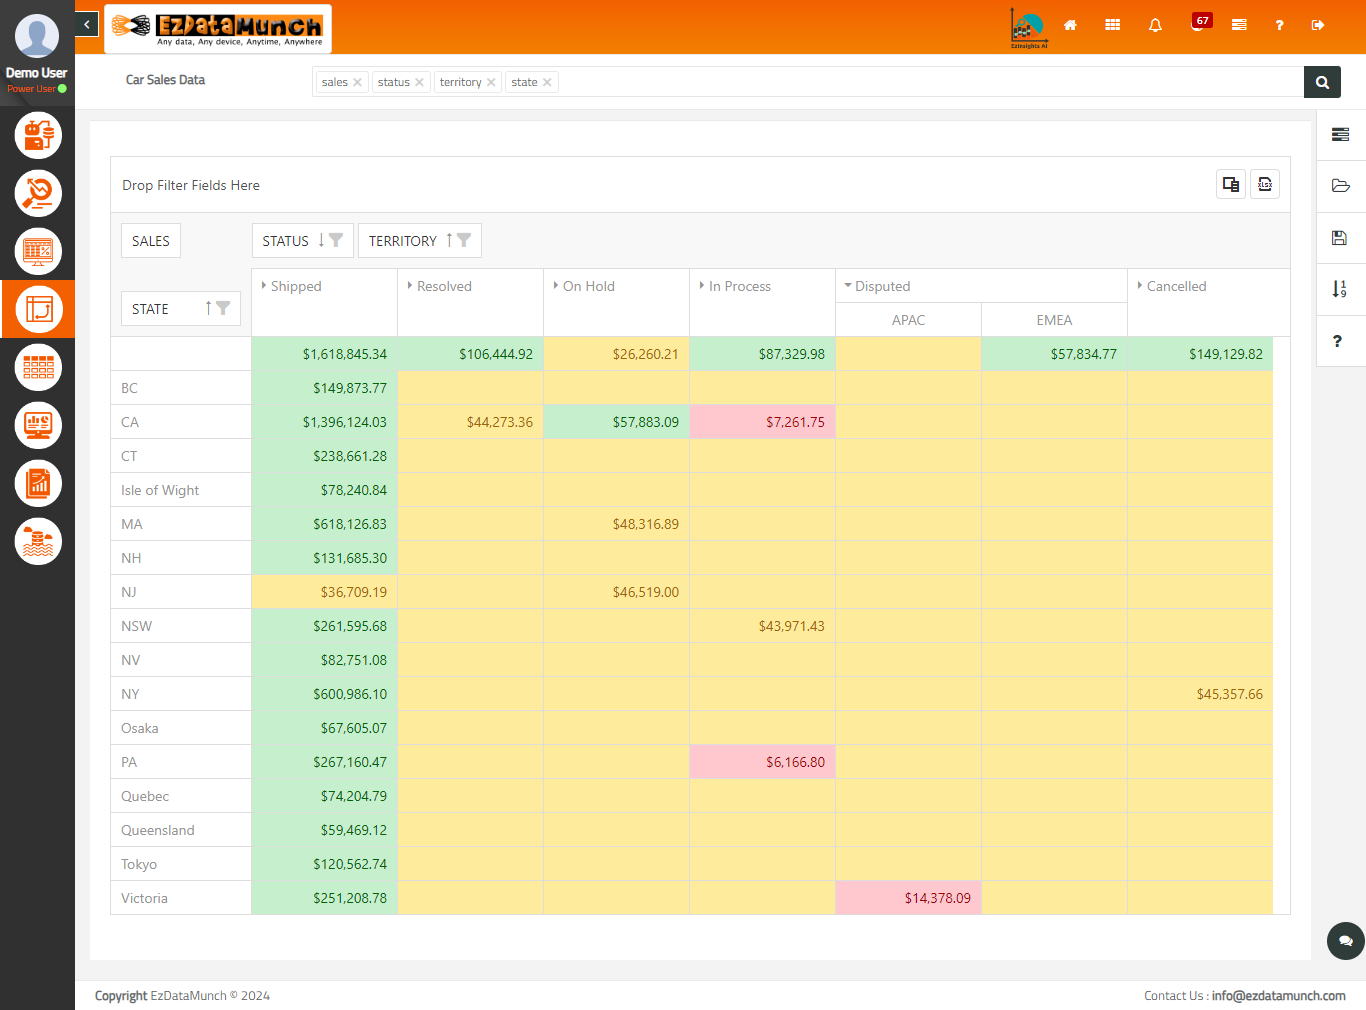
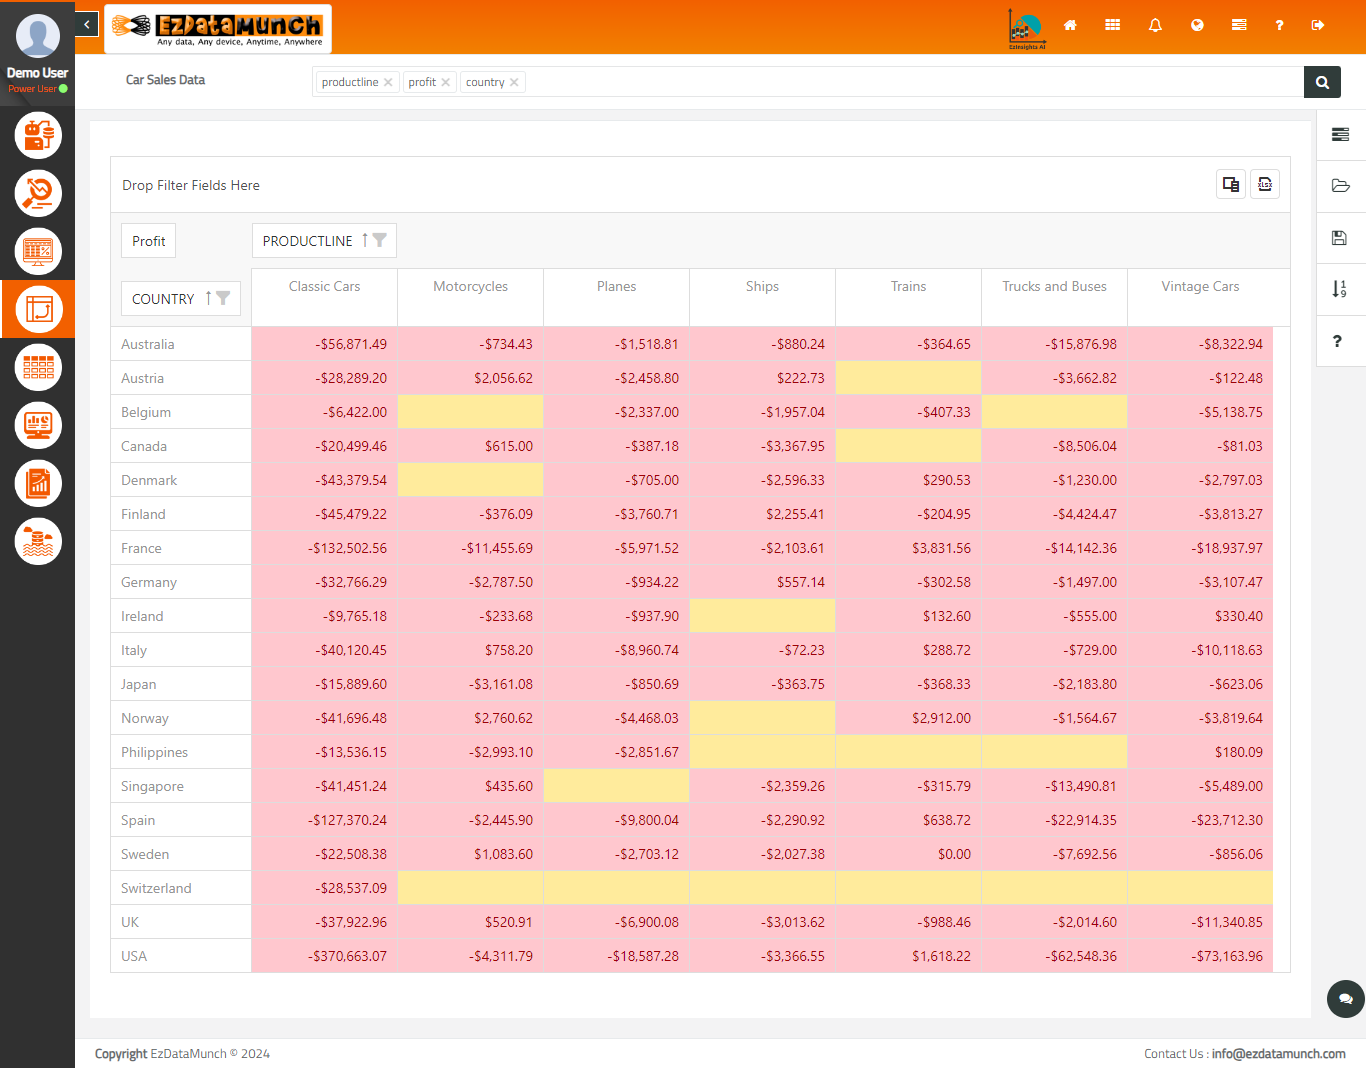
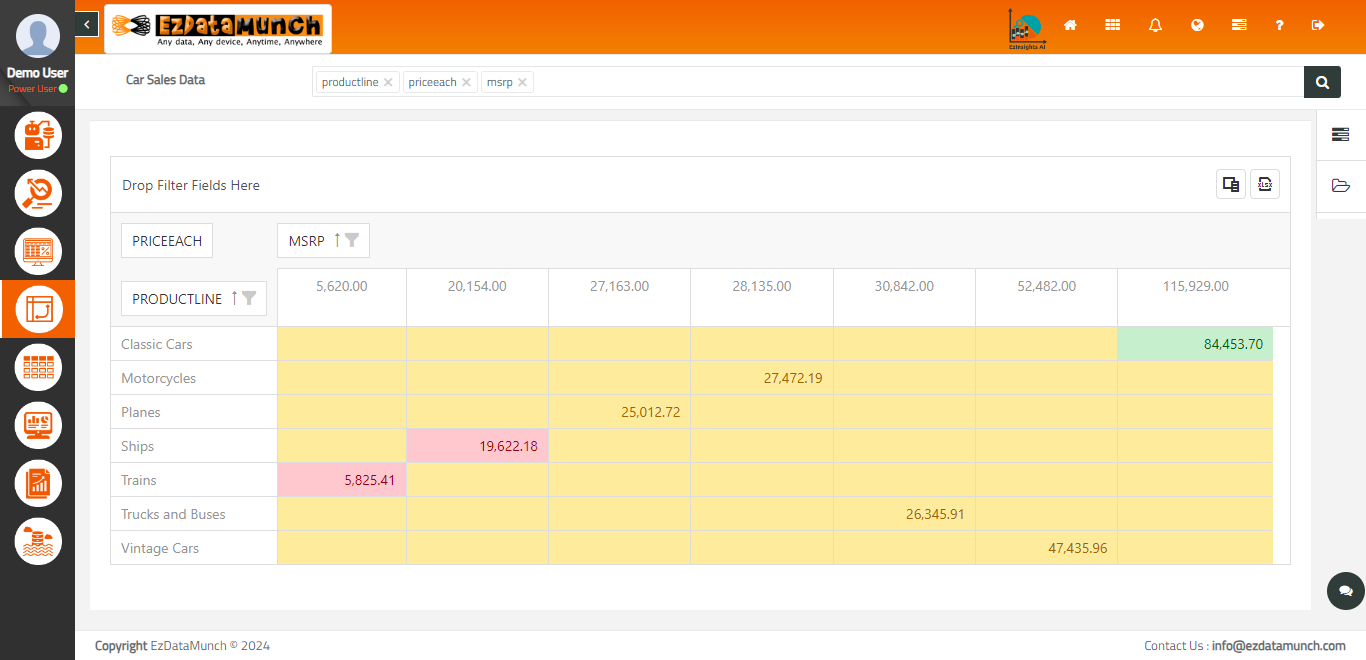
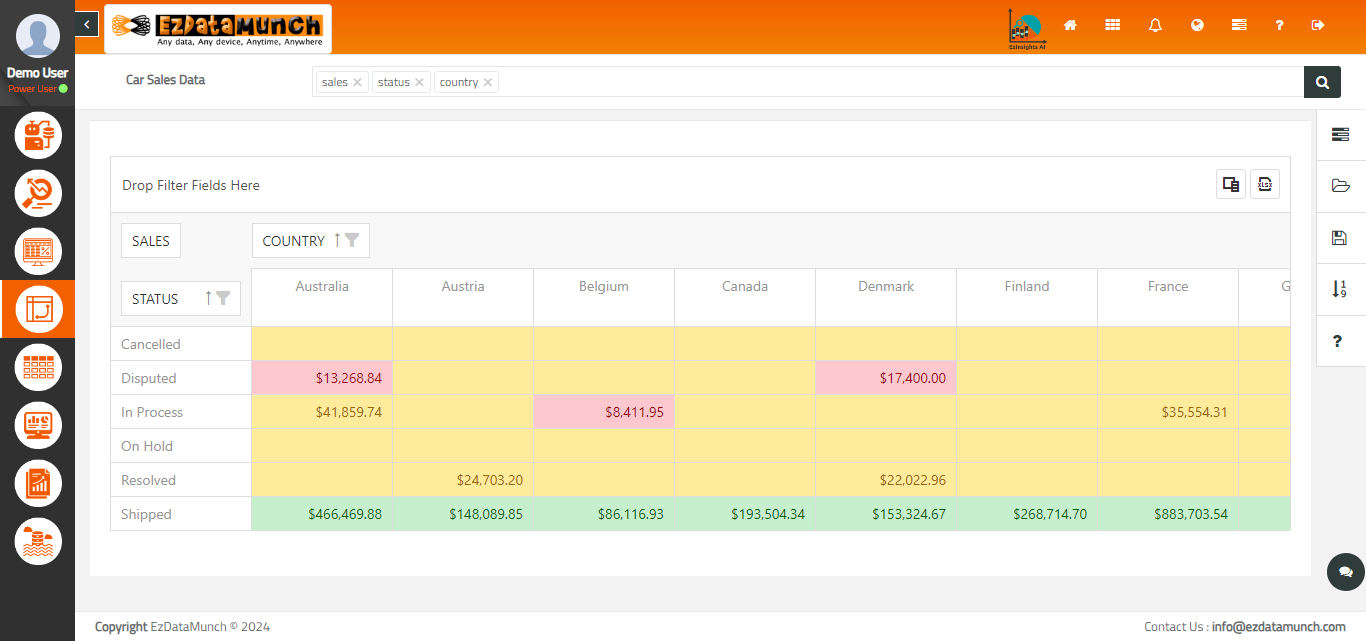
Pivot Analytics Across Data
About EzInsights Pivot
Client-Side Data Processing
OLAP Support
Customization
Data Sorting
Data Visualization & Charting
Data Export
Key Feature
Field Panel
Easily select and organize fields for customized data analysis.
Header Filter
Filter data directly from headers for precise results quickly.
Running Totals
Automatically calculate cumulative totals across rows or columns efficiently.
Summary Display Modes
View summarized data in multiple formats for better interpretation.
Drill Down
Explore detailed data by expanding hierarchical levels intuitively.
State Persistence
Save and restore settings for consistent analysis across sessions.
Chart Integration
Visualize pivot data dynamically through interactive chart representations.
Layout Customization
Adjust grid layout to match user preferences and workflows.
Empower Your Data Transformation Journey
Data Made Actionable
