EzInsights Ad-Hoc Analytics Across your data

About Ez Ad-Hoc

EzInsights Ad-Hoc allows data to be accessible in a way that everyone can see it, understand it, and filter it independently

Drag and Drop UI

Gives people a visual way to pick up and move elements within a view point

i

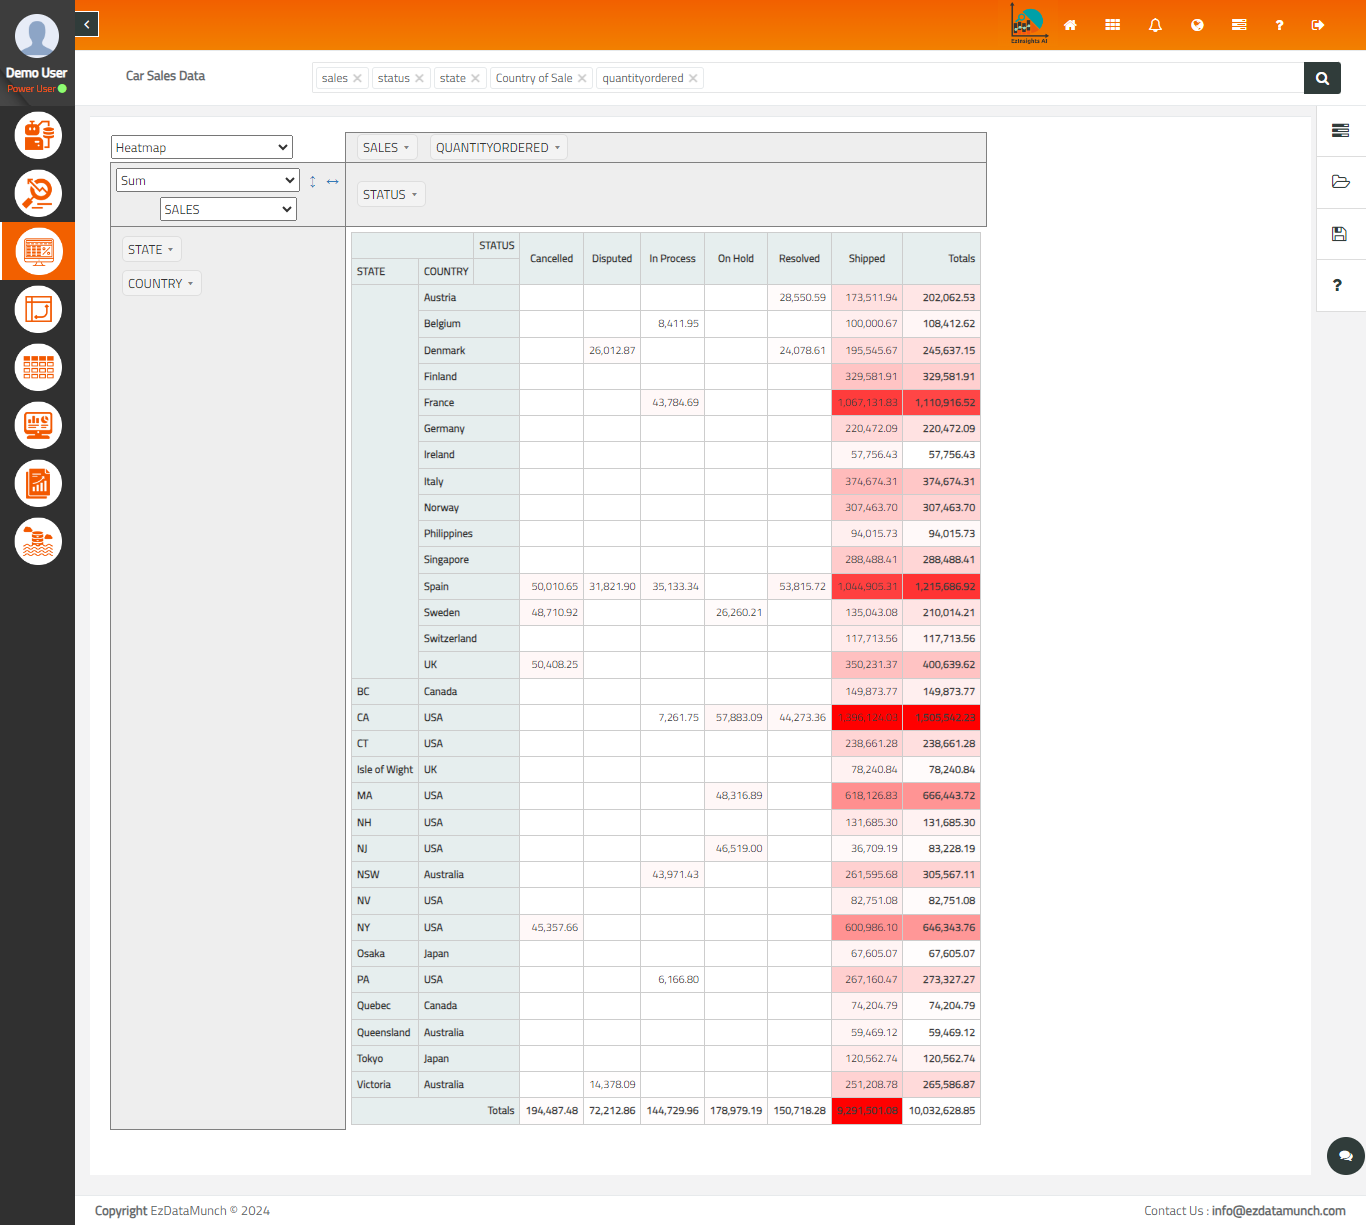
Aggregating Large Data Set

Capable of combining large data sets provide statistics such as average, minimum, maximum, sum, and count etc

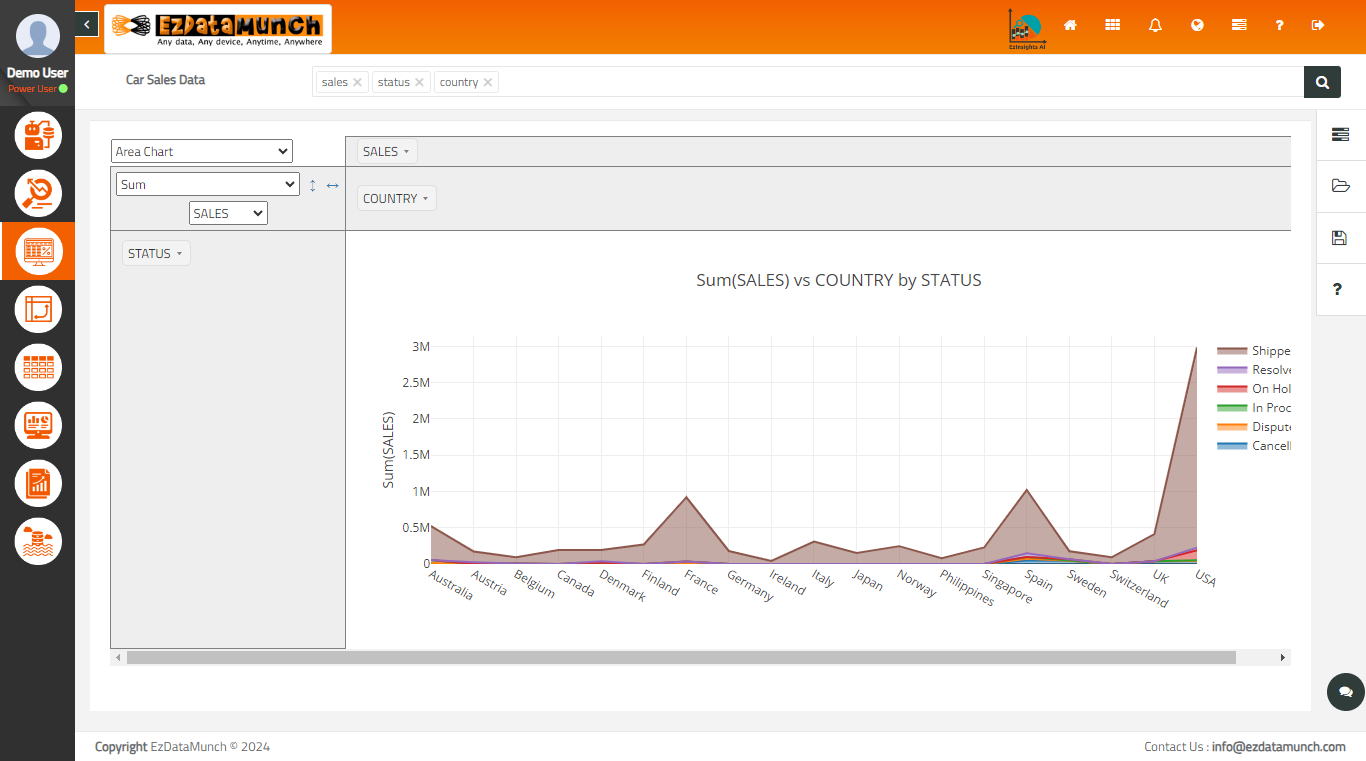
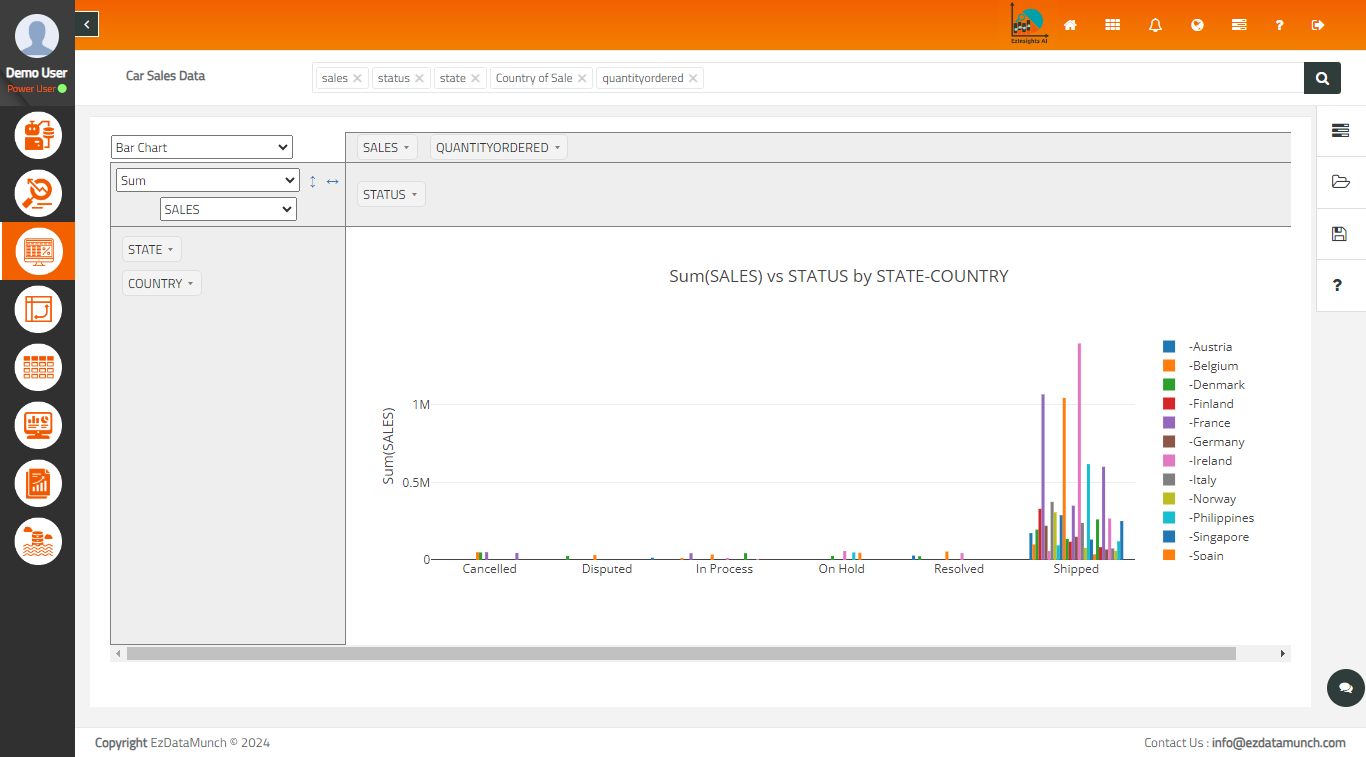
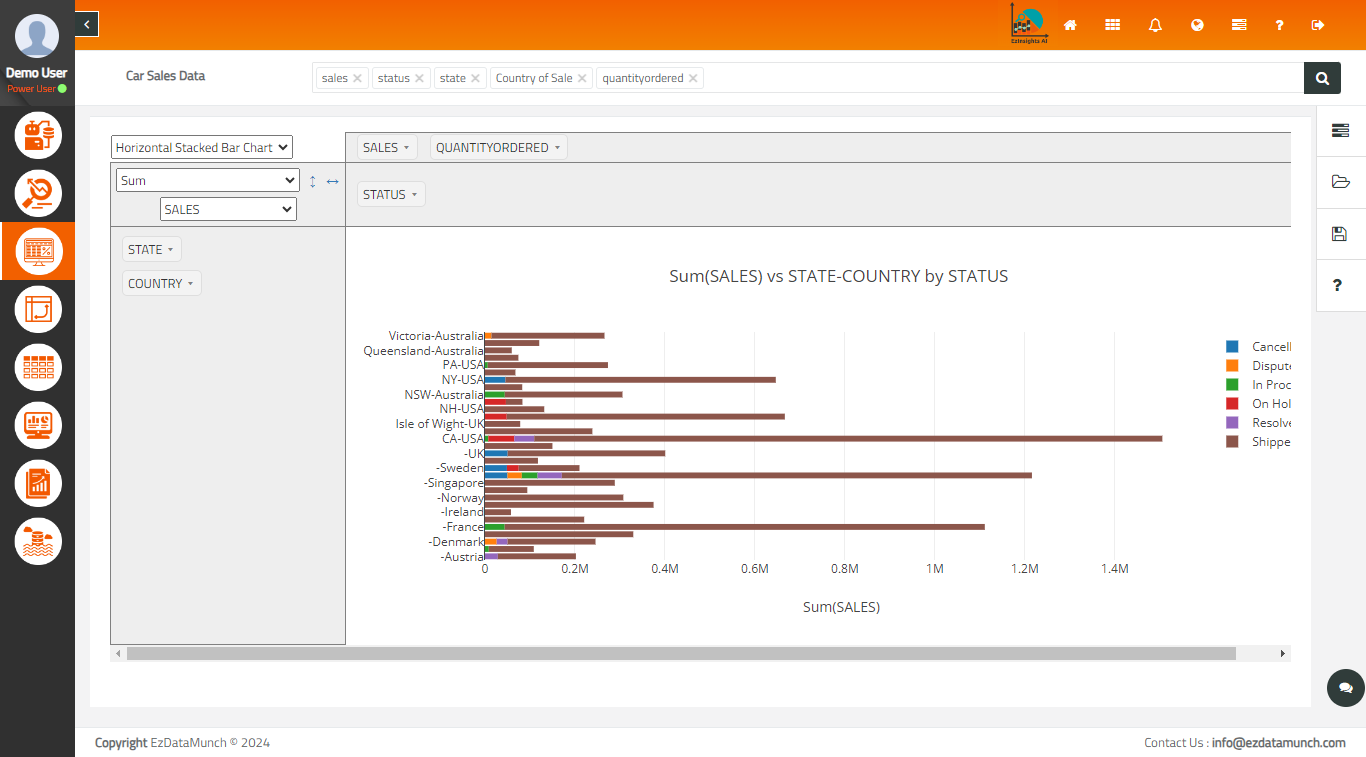
Accelerated Data Visualization

Accelerated data visualization can change not only the way you view your data but also how quickly and effectively you can make decisions

Lightweight tool

Ez Ad-hoc is a lightweight and affordable tool for querying data sources and creating visualizations


Data exploration

Start exploring and visualizing data to uncover insights from the start or identify areas or patterns


Customize experiances

Create custom user experiences and automate multi-step actions to accelerate business workflows


Ez Ad-Hoc

Create visual, interactive experiences using sample data to experience the power of Ez Ad-Hoc

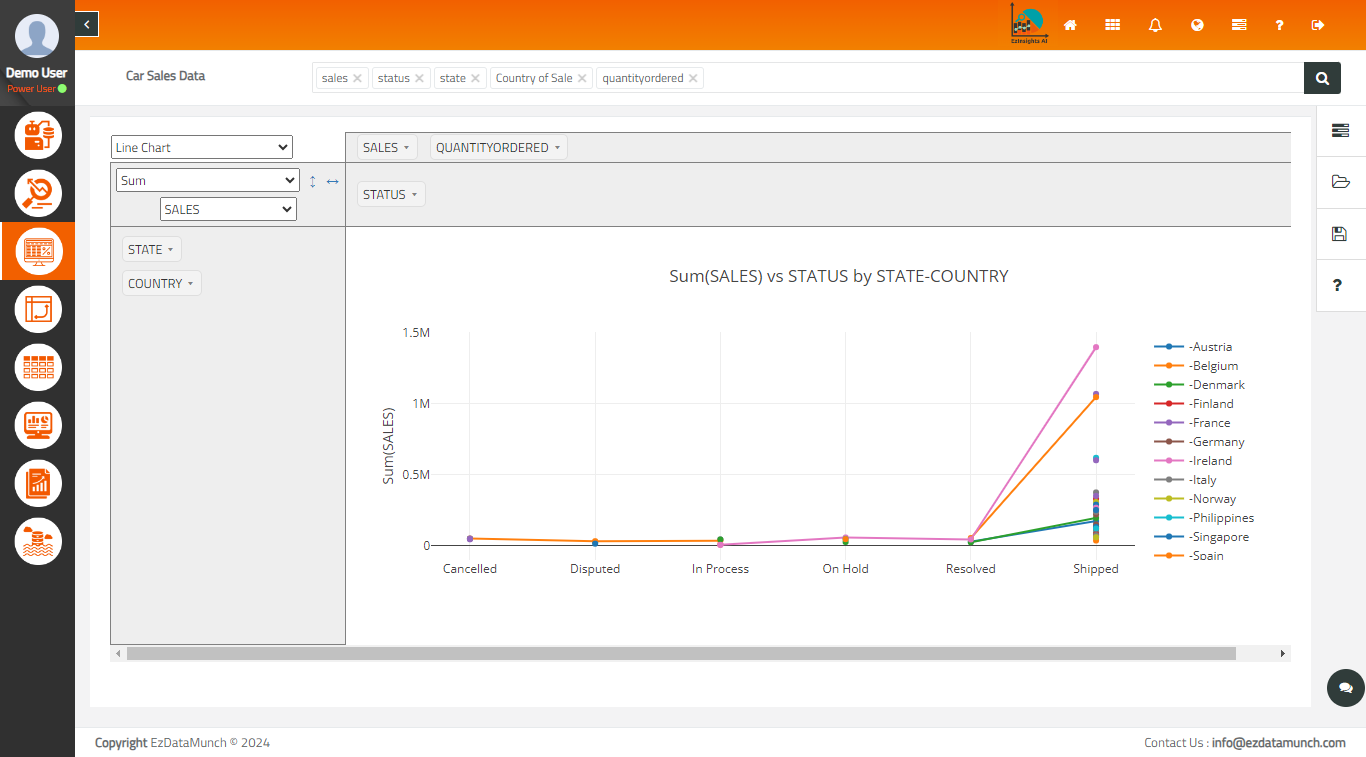
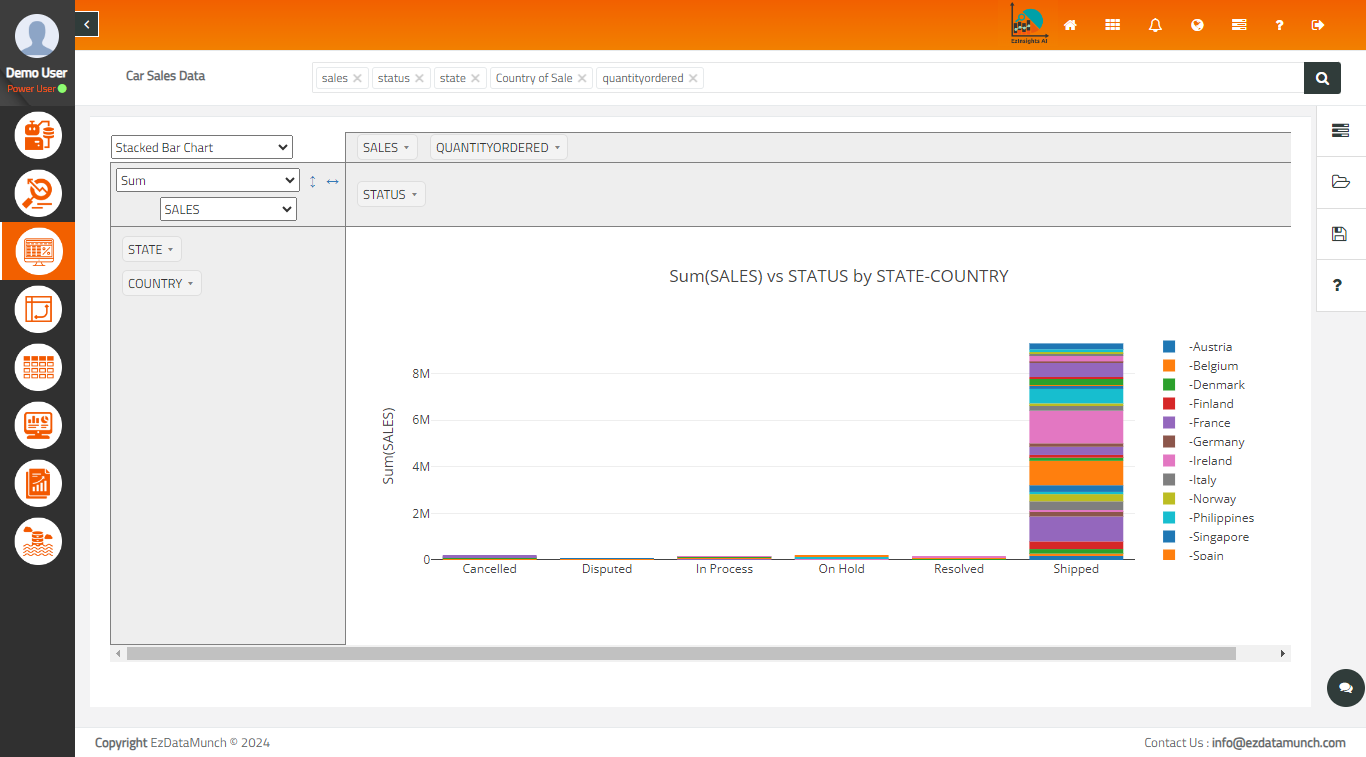
Ez Ad-Hoc Charts Option and Visualization

Examples of chart visualizations available in Ez Ad-Hoc. Including multiple visualization types like table bar chart, row heat map, line chart, area chart etc

Explore to any data, your way, and scale as you grow

Ready to get started with EzInsights?

Register to get your free trial demo today !!!