Search Analytics Across Your Data
About EzInsights Search
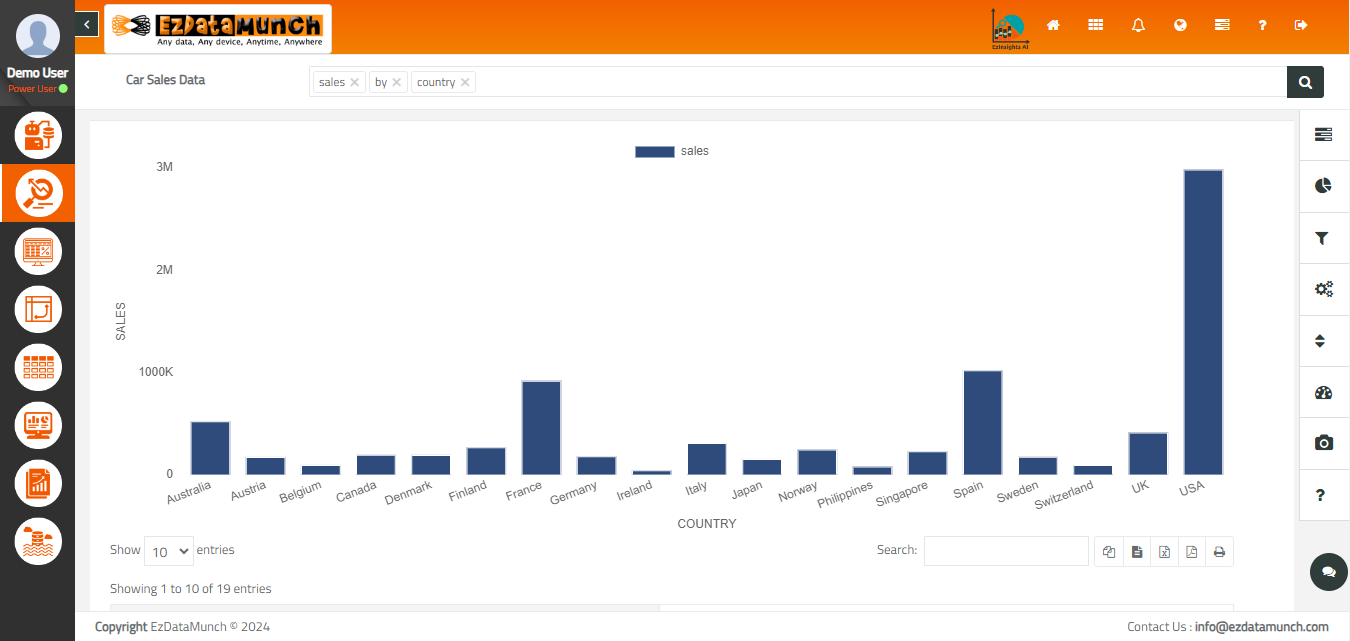
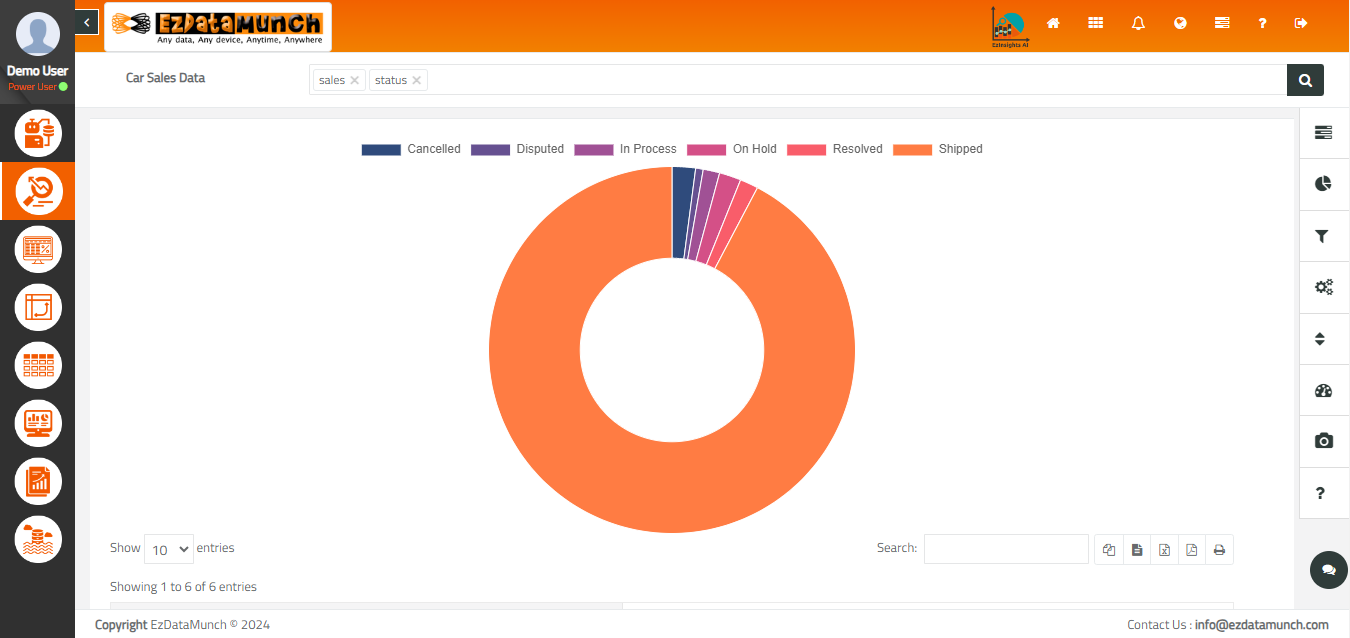
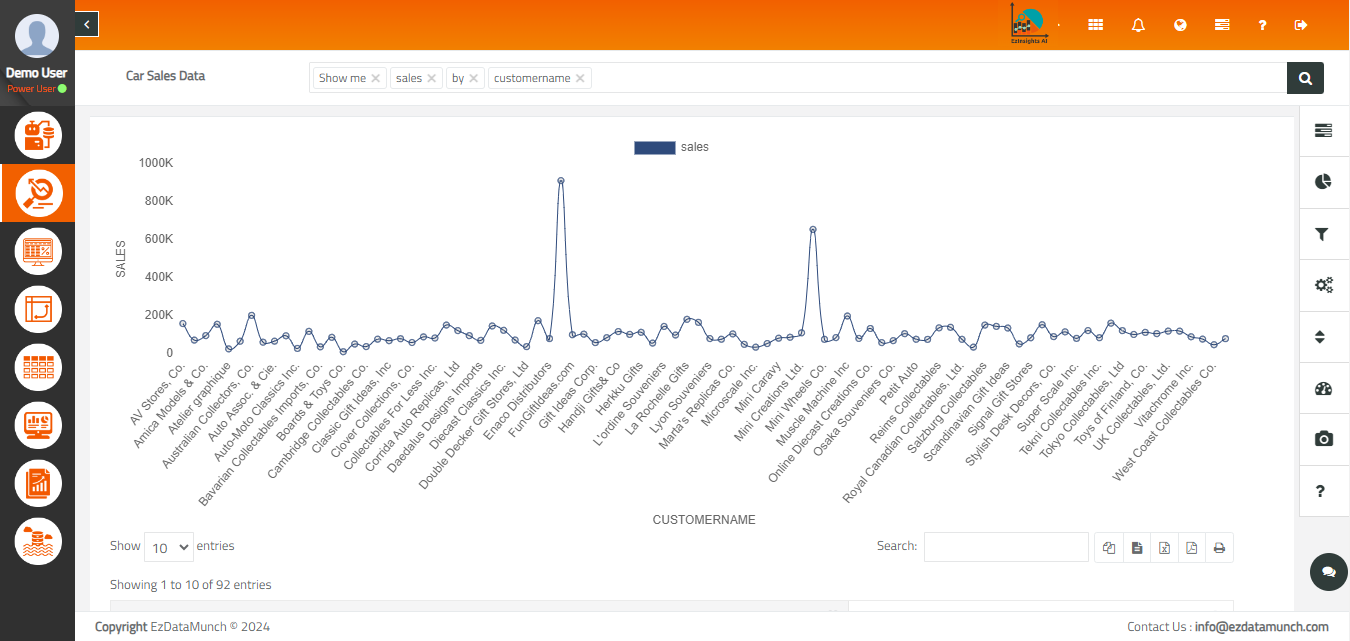
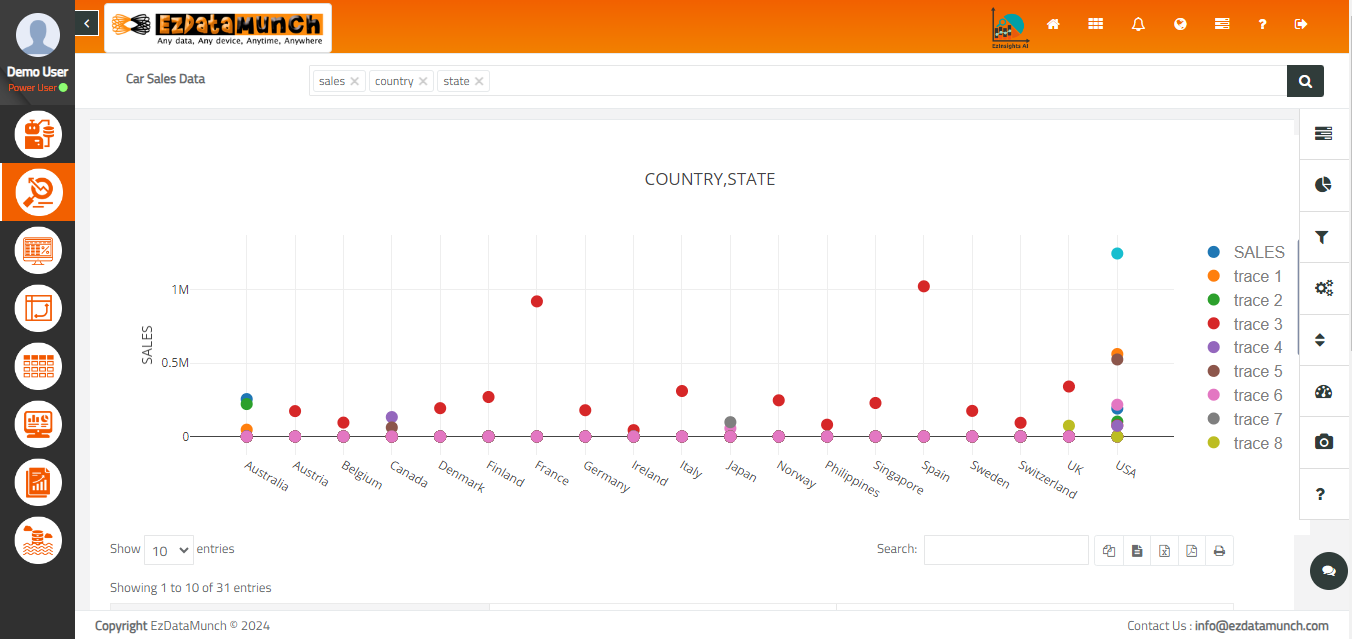
Visualize Instantly
Smart data display
More Visualization Options
Natural Language User Input
Number formatting
Filters
Ez Search Charts Option and Visualization


Smarter Data. Stronger Decisions
