Discovering Insights with EzInsights AI Data Grid
About Ez Data Grid
EzInsights AI Data Grid transforms the way you handle data. With its user-friendly design, powerful sorting, and real-time updates, it ensures a seamless experience. Customize effortlessly and integrate smoothly for enhanced data visualization
Sorting
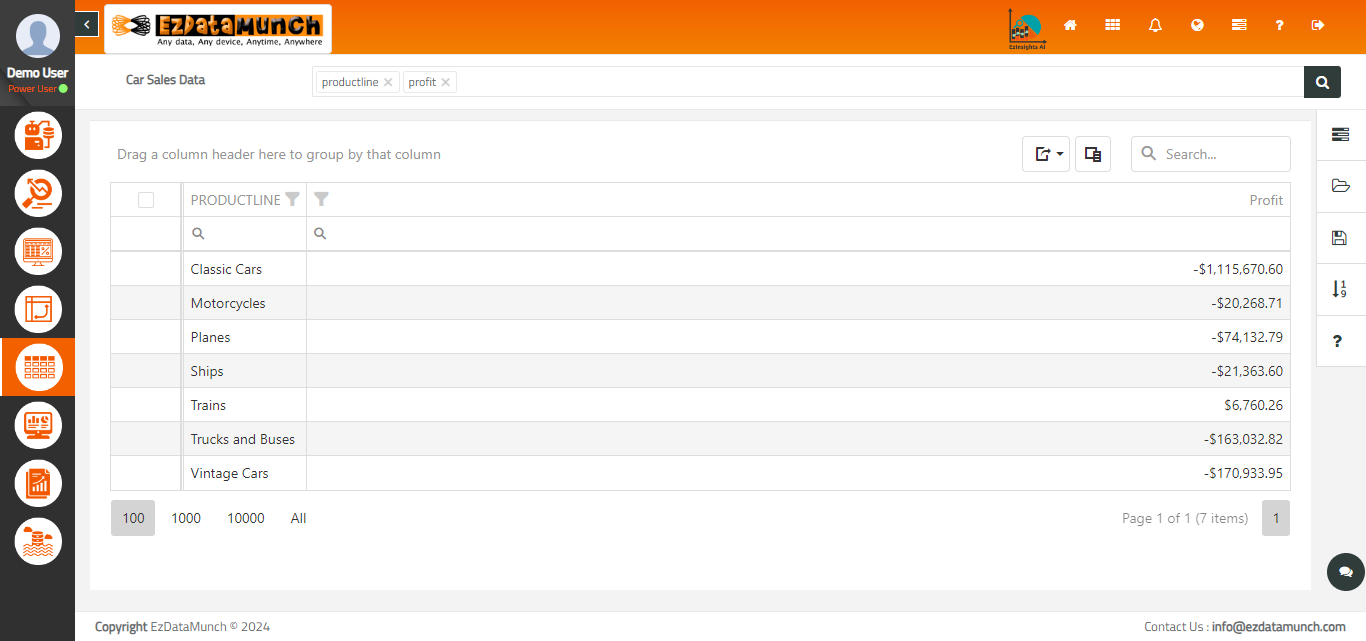
Easily user can sort data by single and multiple columns
Grouping
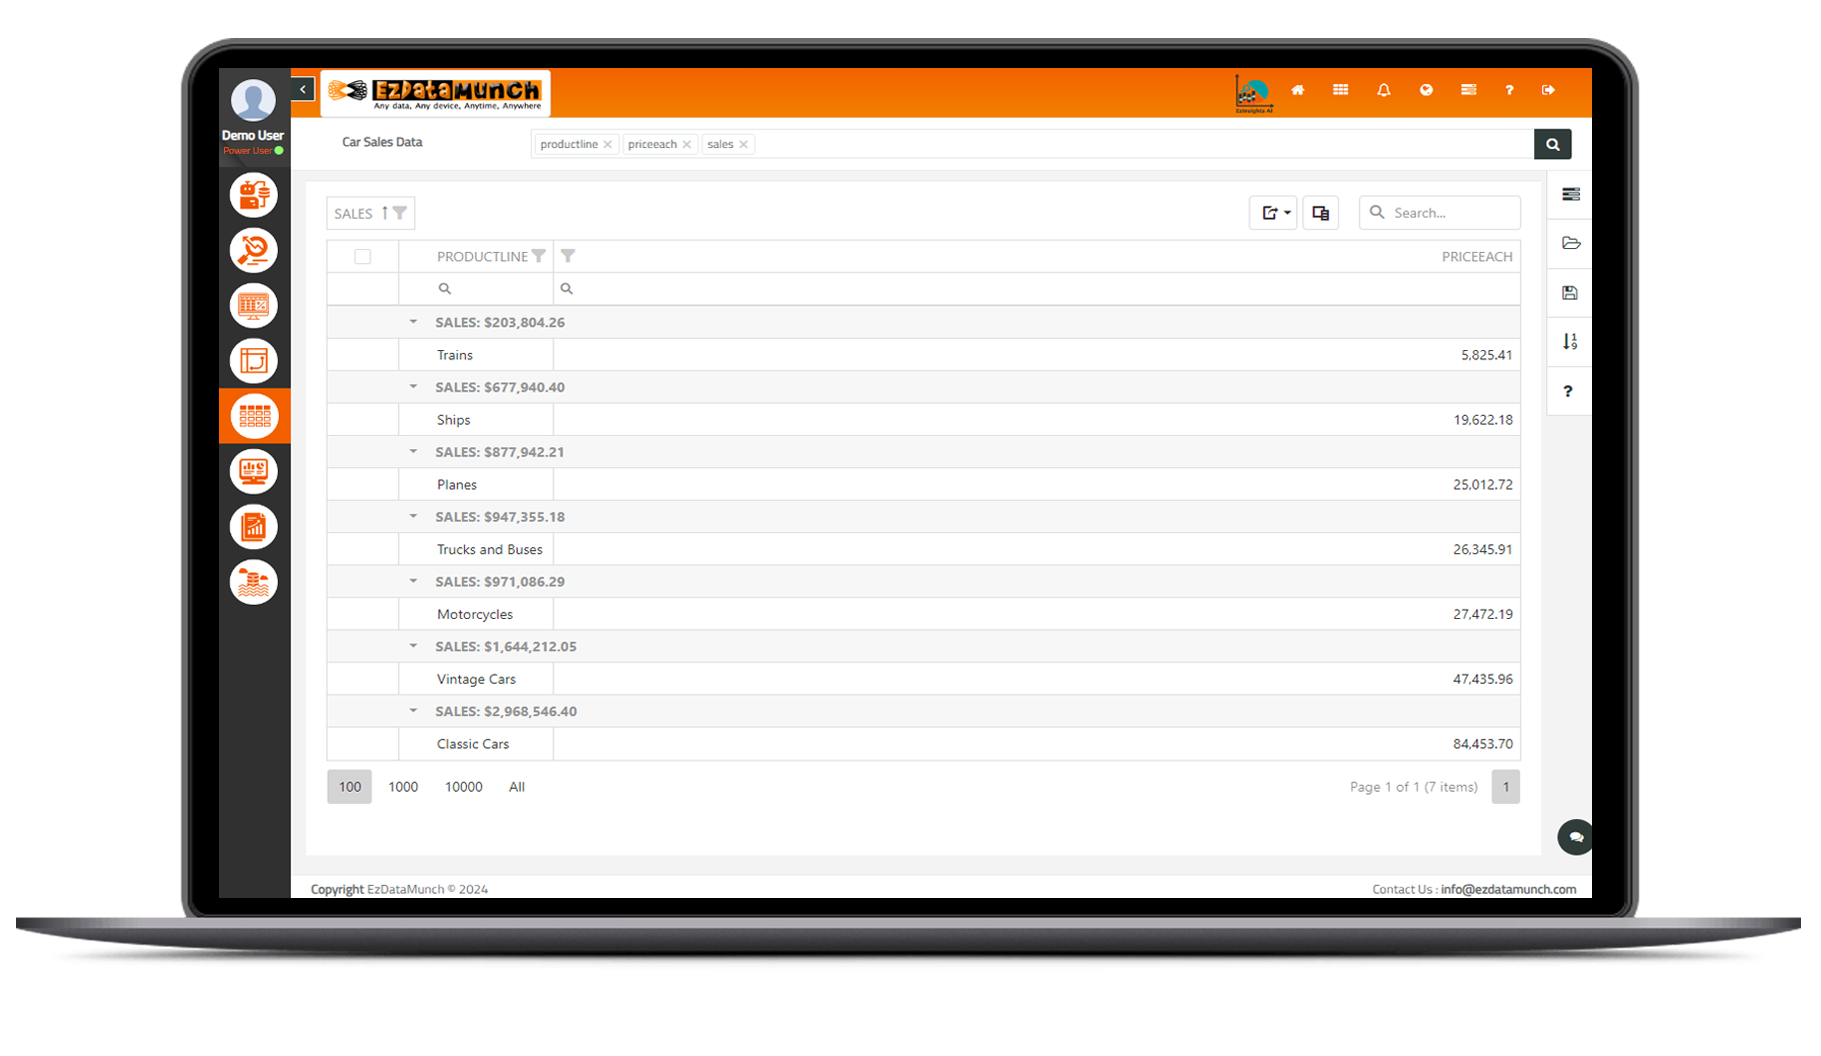
A user can group data in the DataGrid using a column header’s context menu or the group panel
Filtering
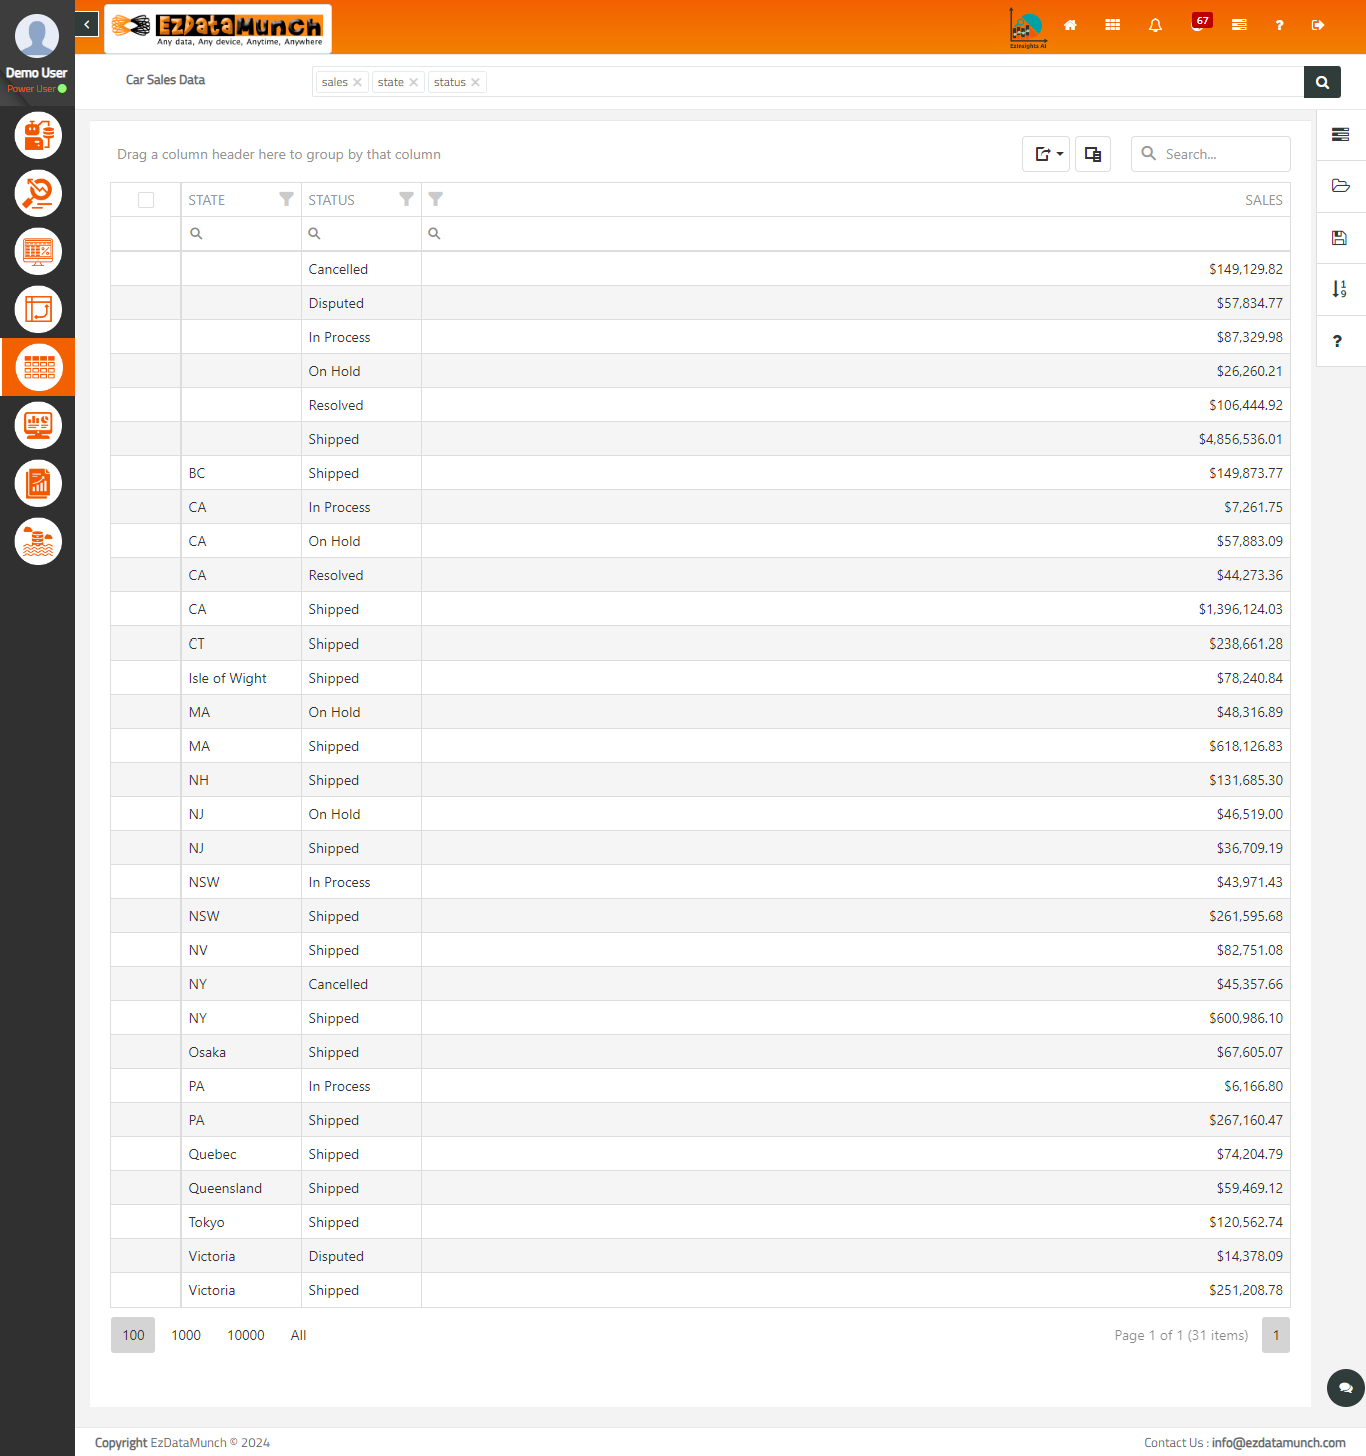
Filtering With row allows a user to filter data by individual column’s values
State Storing
A user can save applied settings and restore them the next time the UI component is loaded
Client-Side Exporting
A user can click the Export button to save an Excel file with the exported data
Master-Detail Interface
A user can view standard data row with an expandable section that contains detail data
EzInsights AI Data Grid
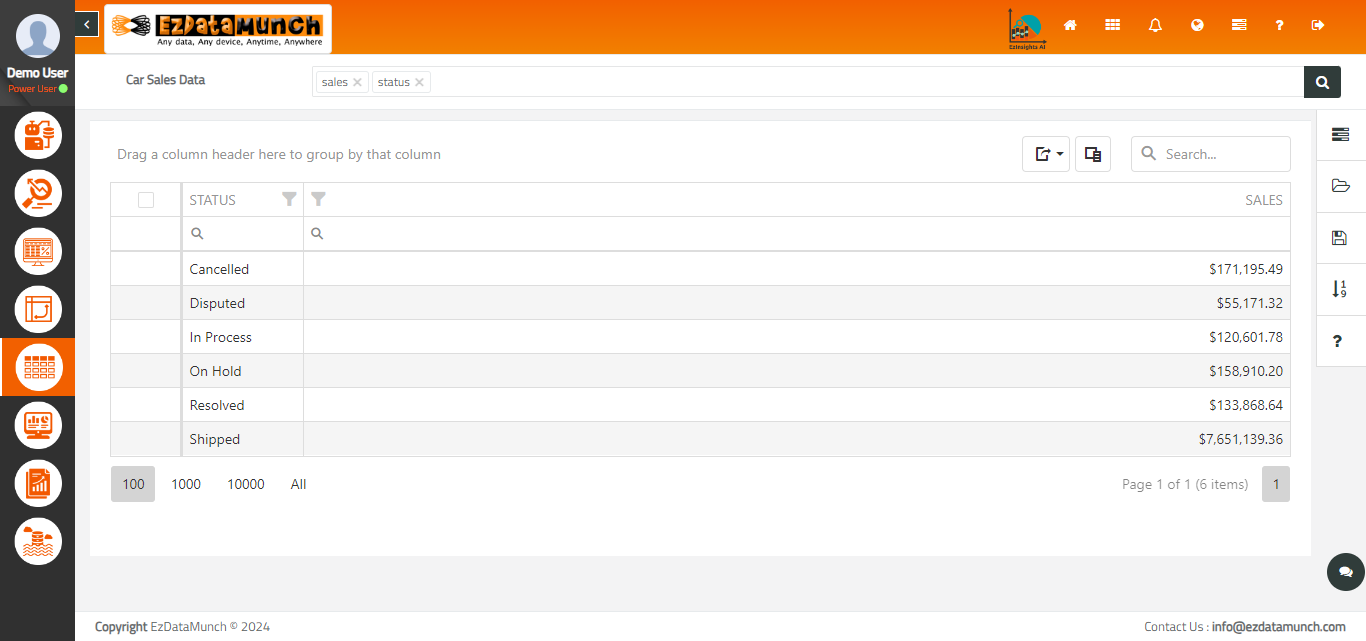
A DataGrid is a UI component that represents data from a local or remote source in the form of a grid.
Next-Level Data Handling
Advanced data management for streamlined operations, unlocking efficiency, and maximizing productivity in the next era of analytics
Explore to any data, your way, and scale as you grow

Ready to get started with EzInsights AI?
Ready to revolutionize the way you work with data? Experience the full potential of EzInsights AI Data Grid today. Whether you’re developing a new application or enhancing an existing one, our solution is designed to meet your data visualization needs.


