Running a business whether it is big or small, comes with many technical aspects such as sales, finance, employees, stocks, and many others at the same time to ensure that your business survives. Business Intelligence has changed the perspective of every business user and has opened doors to a wider audience. For this, you collect data and do your best to track and manage them. But what do you do with all this data and how can you use them to improve your business?
Here BI dashboard tools come to the fore where small and medium-scale businesses get valuable insight into their operations and business activities.
What is Small Business Dashboard?
A small business dashboard is one powerful reporting tool that helps you grow your business and allows business users to track the activities of marketing channels like email marketing campaigns, SEO, and social media. As a small business owner, you will want to optimize your marketing efforts to increase sales. A small business dashboard gives you all the data you need in one place.
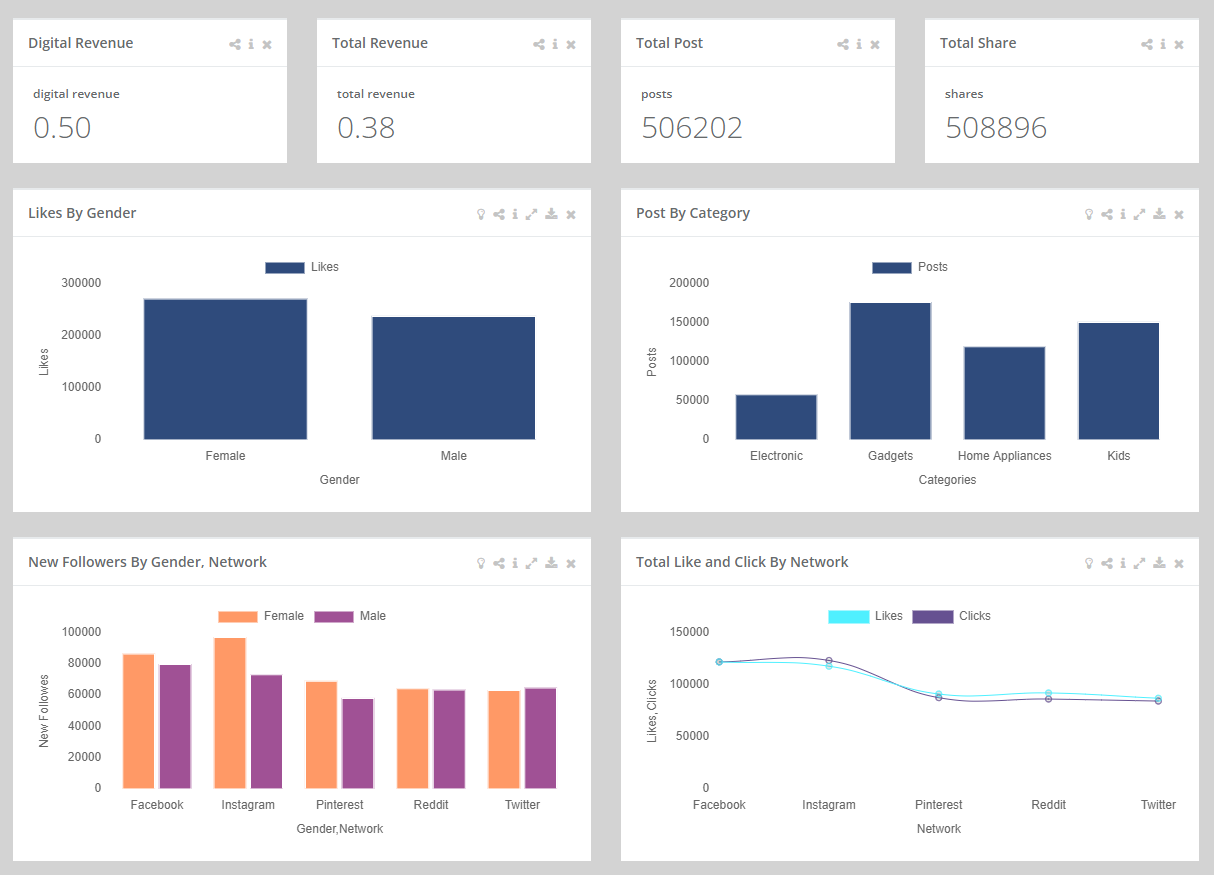
Business analytics tools provide data visualization with a graphical representation or interpretation of your data, and are sometimes used to simplify the transmission of complex information. These visualizations can be presented as graphs, bar and line charts, scales and gauges. With the right charts and graphs, small business owners can stay on top of any developments and share them with their teams.
Purpose of a Small Business Dashboard?
If you are a business owner, you always want to make sure that you make the best use of the monetary and human resources that you are investing and therefore make the business successful and grow.
Using a dashboard with all your important metrics and relevant business data in one place, you’ll be able to easily see where your marketing efforts are doing well and what may need attention. By using a small business dashboard, you will definitely save individual member and organization time. Real-time data analytics will be fetched data automatically from multiple sources, so you won’t need to pull data from each individual platform.
What are the benefits of using the Small Business Dashboard?
In addition to being able to track data across all your marketing channels, a small business dashboard will give you more time running your business and less time creating marketing and sales reports to track your business’s performance. Below are some benefits of using small business dashboard.
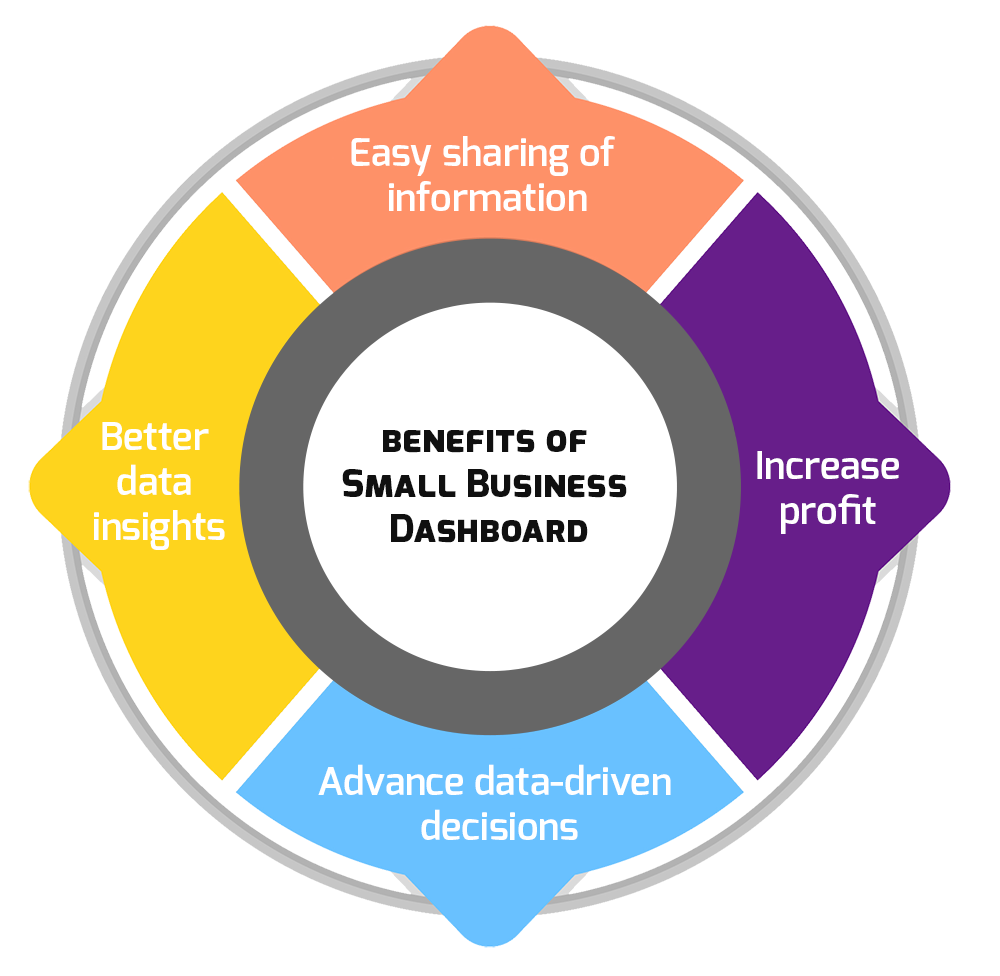
Easy sharing of information
The advantage of using a small business dashboard is that you can pull out a business overview report that everyone can easily understand that can be easily shared among team members. This is why most dashboards can typically be accessed from anywhere, which makes them ideal for sharing information between individuals and departments to maximize collaboration within the organization.
Increase profit and improve productivity
The use of dashboards for small businesses will increase productivity and profitability. This visualization will help visualize the performance of various activities and motivate your team to work hard to improve in areas where they are lacking. If you are aware of where you want to focus and improve efforts then you can definitely get better results.
Advance data-driven decisions
In the olden days, the organization decision was taken on the basis of the opinion of the management. But with advanced business intelligence tools, business leaders are able to see how their company is actually performing based on the objective results provided by the data. It removes the role of inference in designing the optimal company strategy, allowing data-driven decisions to be made that can maximize business success.
Better data insights
With the help of a powerful online dashboard, you can know what is going on in the company at all times and know your business data insights better. Small business KPIs dashboard provide a big picture of the story told by the data displaying the data in easy-to-understand visualizations that clearly show trends and patterns as well as the figures that matter most to businesses.
Small business dashboard best practices
It’s widely known that tracking your data and making decisions is one of the keys to success in the small business world. Small businesses use business intelligence tools that help to run business more efficiently and stay on top of everything, and have no time to do any of it.
Small Business Dashboard & KPIs Examples
In this article, we have discussed the various reasons why you should adopt dashboarding practices to access your small business reports. Now, let’s see how they work with a list of examples.
Sales Performance Dashboard
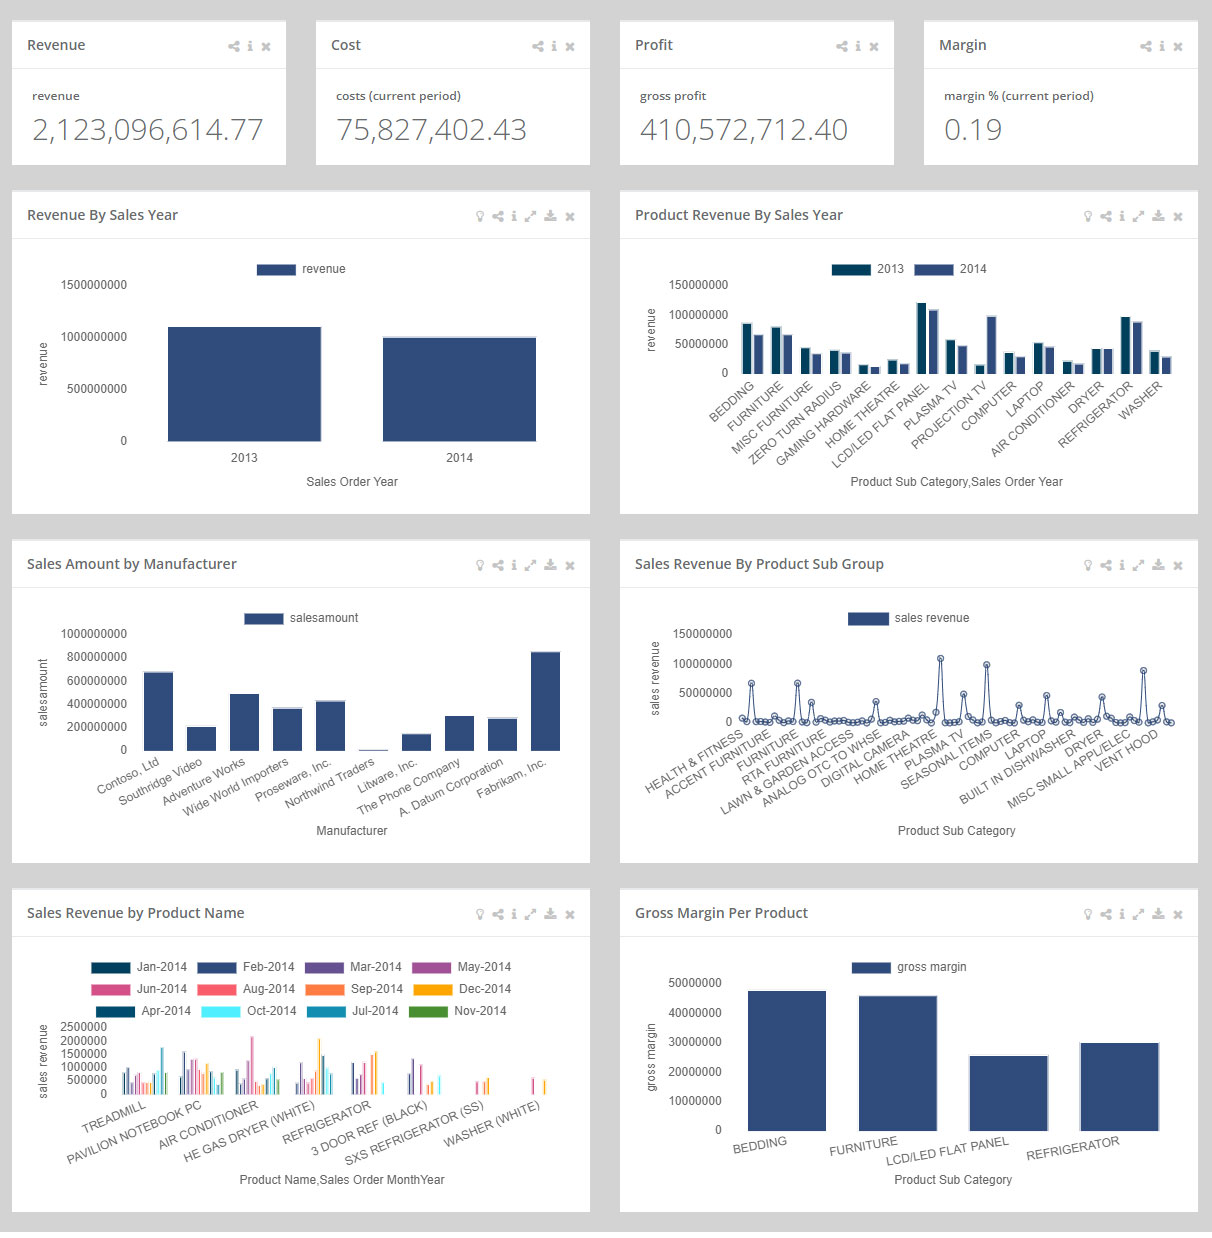
EzInsights sales dashboard example is a visual sales reports that show the overall sales team performance during a specific time frame. It can be analysed on a weekly basis as well as long period of time. These automated dashboards pull all sales data in a single report and saves you time and effort from jumping from one platform to another.
Cash Management Dashboard
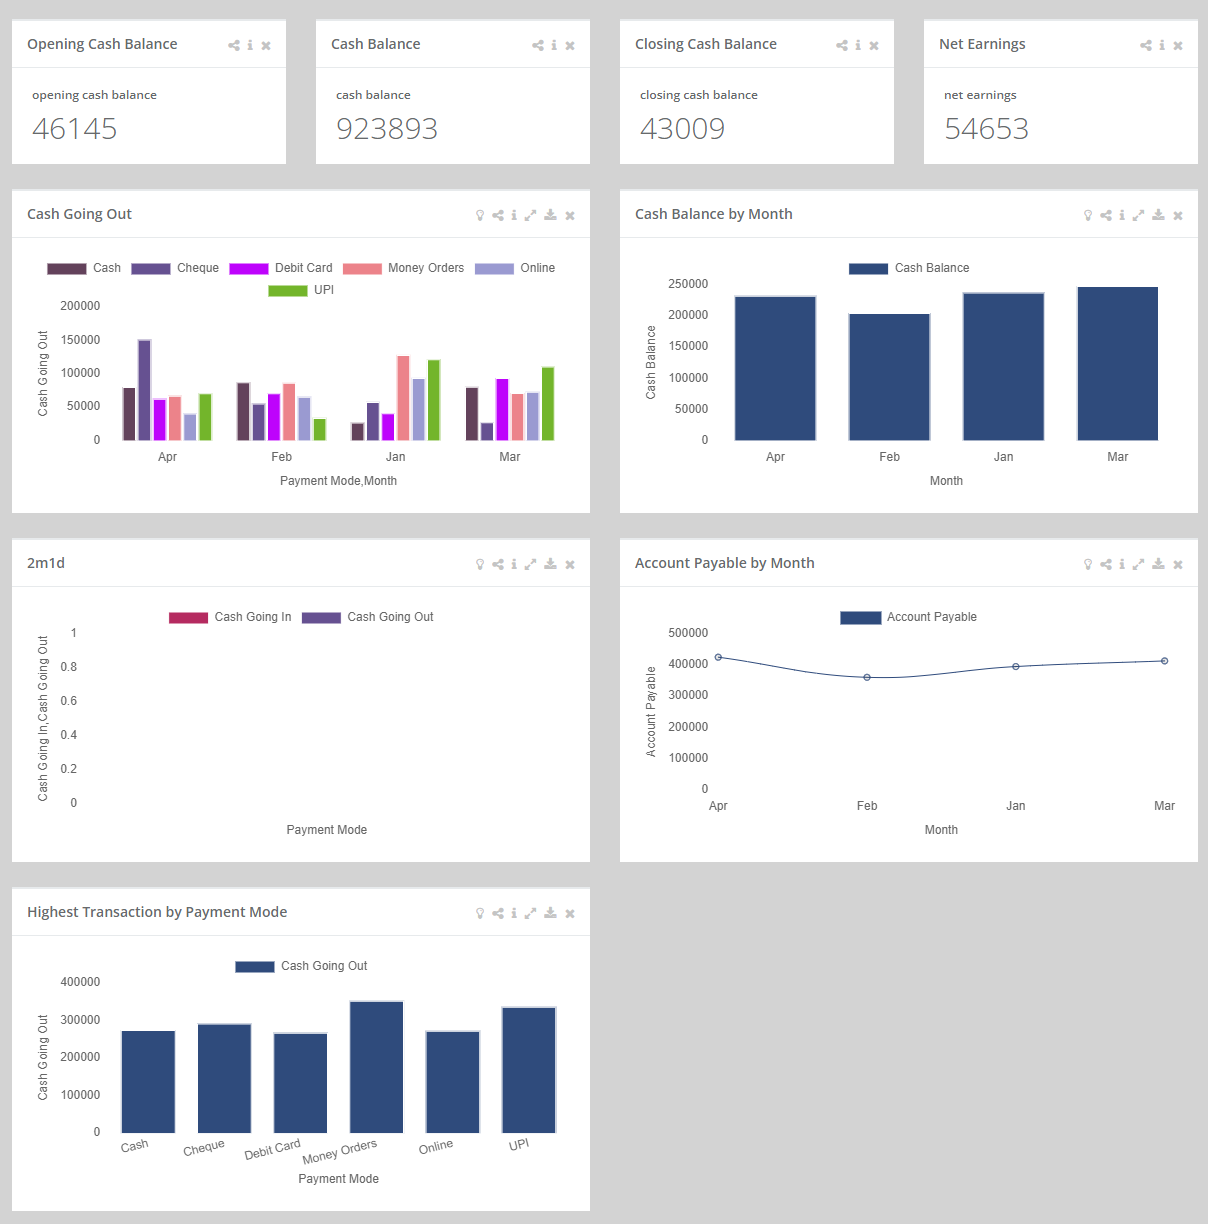
The Cash Management Dashboard is a visual summary of your cash and liquidity in real time and also gets a suggestion on how you can improve the flow in a business. The Cash Flow Dashboard template helps you scale up strategic and analytical efforts related to key cash flow aspects of your organization. The key KPIs and metrics included in the Cash Flow Dashboard are:
- Net operating cash flow: Net cash flow resulting from operating inflow and operating outflow i.e., buying and selling activities of a business
- Net financing cash flow: net cash flow resulting from financing activities of a business i.e., cash increase form new debt or cash decrease through the payment of old debt
- Net inventing cash flow: net cash flow resulting from an increase from share capital or selling of fixed assets and cash decrease from new investment in buying of new assets.
- Inventory: days inventory outstanding and inventory trend over the periods
- Account receivable: days receivable outstanding, total receivable, overdue receivable, and receivable aging.
- Accounts payable: days payable outstanding, total accounts payable, overdue payable, and payable aging.
Marketing Performance Dashboard
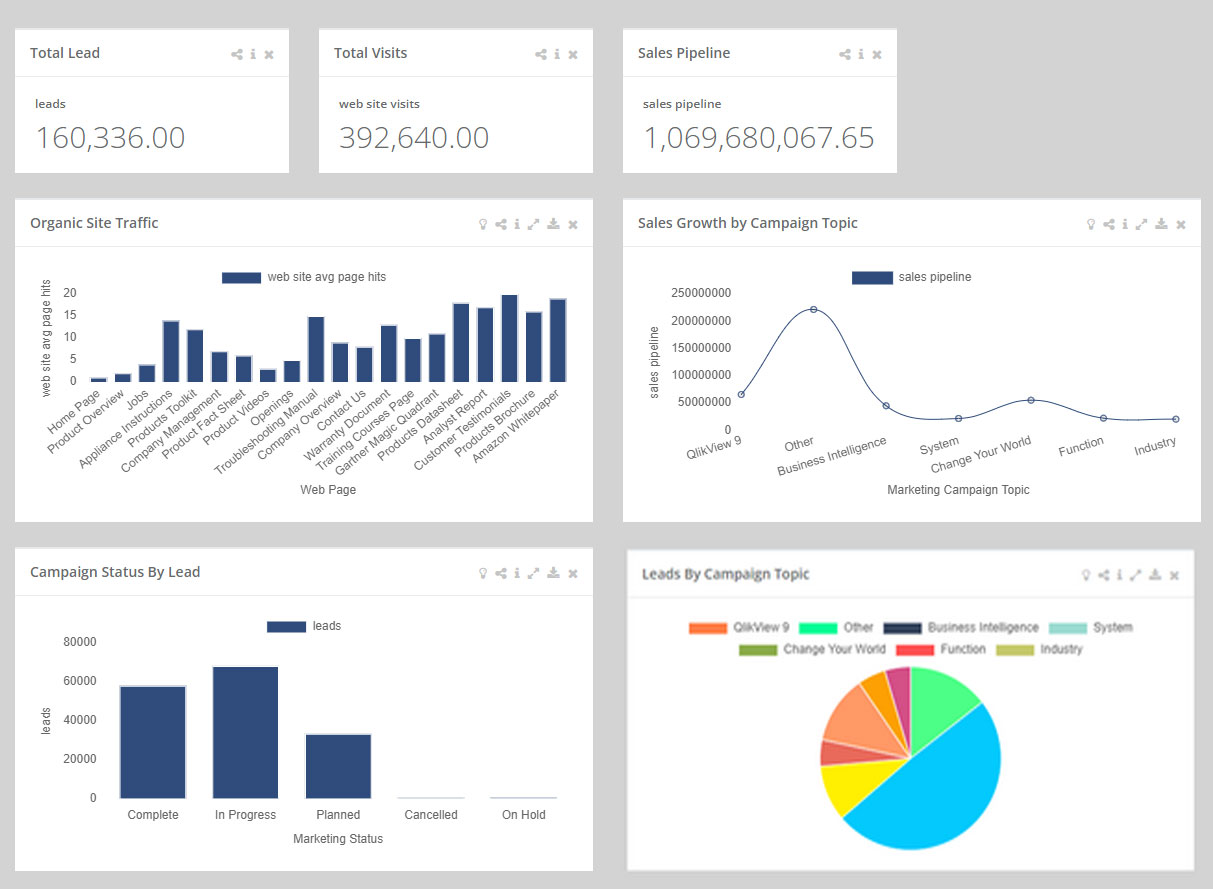
EzInsights Marketing Performance Dashboard aggregates data from various sources and visualizes it in one place in real-time. They provide a high-level overview of how promotions are performing, providing marketing experts and C-level executives a source of truth as well as an opportunity to dig in for a more in-depth analysis.
Recruiting Dashboard
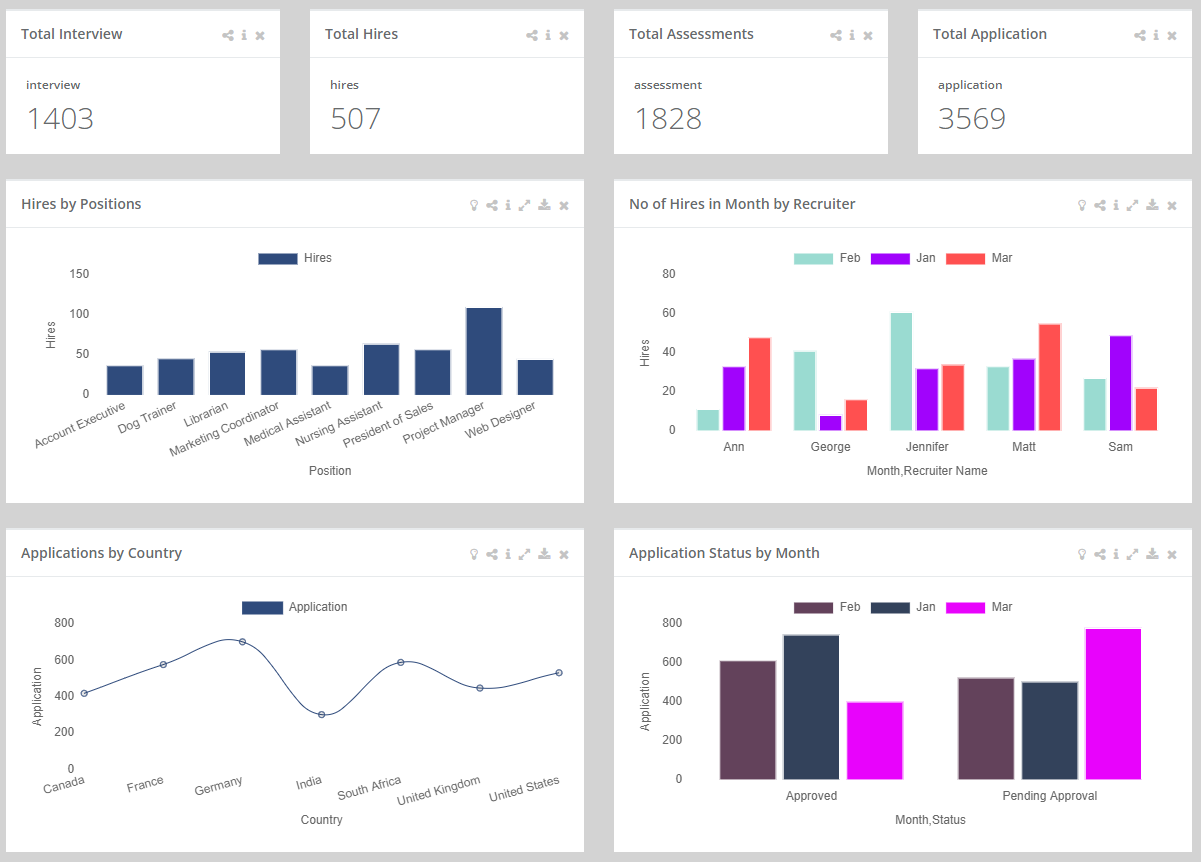
Recruitment is at the core of any organization. This dashboard can help you bring together a rundown of all the recruitment data in your organization, helping you predict what’s going to happen and plan your next actions.
Conclusion
In this article we have explained why small business dashboards are important and also, we have explained some real-life examples. The level of knowledge provided by these analytical tools will not only help in making accurate decisions to ensure financial success, but will also help in managing day-to-day operations by automating. If you’re ready to test out the best dashboard software for small business, try EzInsights today!

Milan Desai
Chief Technology Officer
Milan Desai has more than 20 years of industry experience in working with clients to solve business problems. Passionate about leveraging technology for improving the quality of life and optimize the use of resources. Currently, working on utilizing data to drive business decision making process and user understanding of key metrics that drive the organization and markets in general. Co-founder of EzDataMunch – the first BI Apps store in the world.

