Data plays a very important role in any business. The power of data has become more and more popular among business experts and investors. According to the BI survey, projects that 80% of data-driven industries will use data discovery in the next few years. This means that every business must now secure and organize their data in the proper format. This is where data discovery comes into the picture.
Data discovery is a process of collecting and evaluating and analyzing data from various sources like databases etc. It is often used to understand trends and patterns in data. The data discovery process provides security and organizational solutions, among other things. In this example, we have explored the process of data discovery along with the use case.
What Is Data Discovery?
Data discovery involves the collection and evaluation of data from various sources. It is a business user-oriented process to detect patterns and outliers by navigating the data visually or by applying guided advanced analysis. Data discovery relates to business intelligence (BI) which helps businesses to make informed business decisions.
The Data Discovery process

Data discovery is an ongoing process that involves the detection of patterns, outliers and errors in large structured and unstructured datasets. It works in four main phases: preparation, visualization and analysis. These steps continuously work together to provide hidden insights, potential security breaches, and visual mapping.
1. Preparation
The first step involves a quality data discovery process so that the data analysis work of data discovery can run more smoothly. This is an important step as the raw data will be complex and confusing. Hence, it is better to clean and refine the data before moving on to the next step. There are many automated tools that can remove outliers, integrate data formats, detect null values, and standardize data quality.
2. Visualization
Once all data points have been converted into a consistent and readable format, the data enters the visualization phase. Visualization also refers to data mapping, which displays the finished data in visualizations such as graphs and charts, etc. These visual data visualizations help business experts and business managers to visualize the details of business insights. These visual guides display the primary trends found in the dataset being processed as a result of data mining, data preparation and sorting.
3. Analysis
After the mapping and visualization process is complete, the data is then analysed so it can be summarized and organized into a concise readable format. Oftentimes the analysis process involves summarization in the form of descriptions.
4. Repeat
Data discovery is an iterative step and repeats the same step also for other data analysis processes. For businesses, this means that in order to unleash your data’s potential this process must be repeated and built upon regularly.
What are the benefits of Data Discovery?
- Discover the characteristics of your data and gain insights to address complex data risk concerns.
- Spend more time analyzing data insights as AI-powered automation streamlines data classification and monitoring.
- Find out where your risk data is within days instead of weeks
Different Data Discovery use cases
There are many use cases of data discovery but some of the most useful use cases are strategic dashboard, Analytical dashboard and advanced analytics.
Strategic dashboards
They are created with a focus on in-depth analysis. KPI metrics, such as last quarter’s revenue, can be included in this study. Strategic dashboards are excellent for presenting information to department heads and C-suite executives because of their design.
Analytical dashboards
Analytical dashboards allow users to research and experiment with data quickly. These dashboards are famous among IT and development teams.
Advanced Analytics
Advanced analytics uses data science beyond traditional business intelligence (BI) methods to predict patterns and predict the possibility of future events. This in turn can help an organization to be more responsive and can significantly increase its accuracy in decision making.
Top Characteristics in Data Discovery Tools
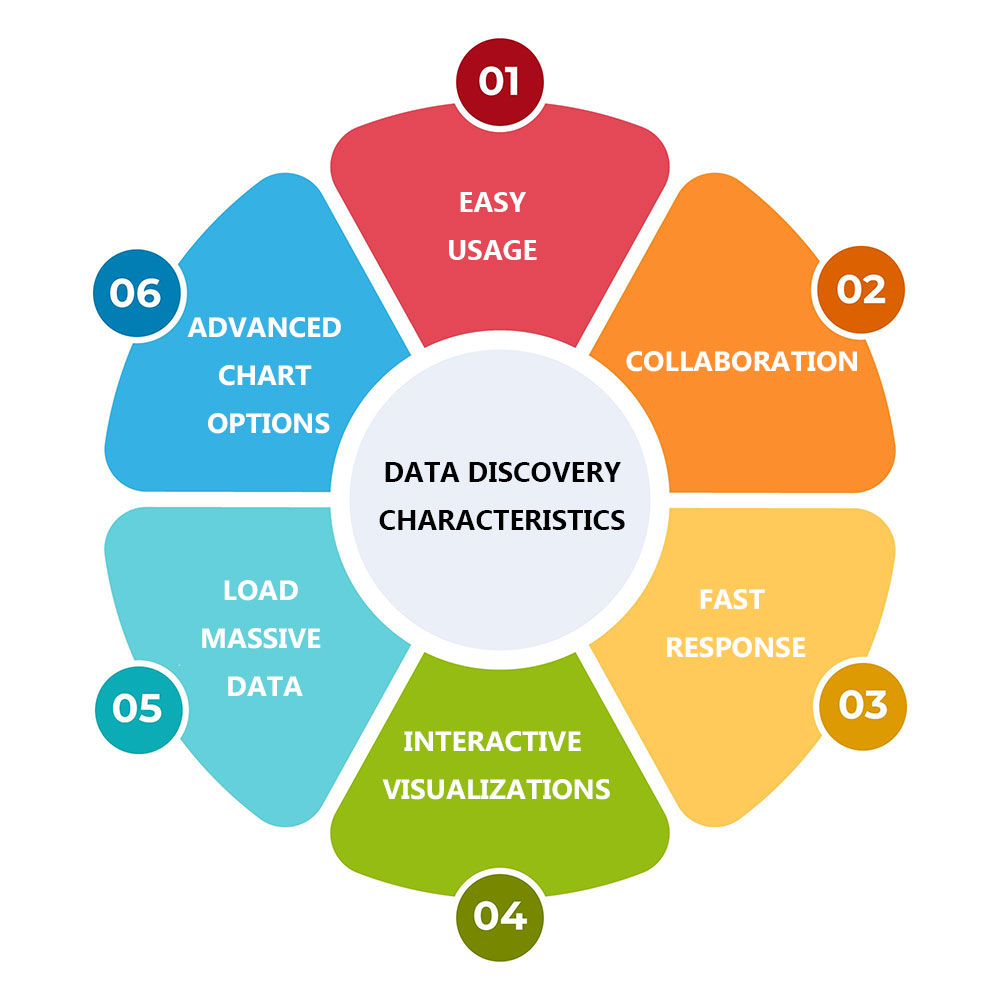
There are tools that currently exist in the form of a business intelligence software – platform specifically designed to improve traditional BI capabilities. Here we leave you a list of the main features that this type of tool should include:

Easy usage
Business in the olden days relied heavily on professional analysts or IT specialists to deal with the data discovery and analysis processes. But the introduction of modern technology and the democratization of data has brought about a change. One of the best features of using the tools is that they provide the best interface and easy-to-use operations. This will empower everyone in your organization to take advantage of the information and tools available to them.
Collaboration
Sharing reports and collaborating across organizations is what makes a business successful. Sharing and collaborating is one of the best features of data discovery tools. Being able to easily share insights and reports will increase communication between teams leading to a more productive environment. Even you can automate or create a scheduler for your valuable clients so that they can get timely information.
Fast Response
Data is growing rapidly in every business. Hence, these tools provide an online data analysis tool to get accurate information of a business so that the business can take advantage and get a competitive advantage for the business.
Interactive visualizations
Always visuals are much more attractive than numbers. For this reason, a quality data discovery tool should include powerful and interactive visualizations that will make the process of working and analyzing the information smooth and easy to understand.
Load massive data
Visual Discovery is helping to expand traditional business intelligence and improve efficiency. If you have multiple databases from different touchpoints, you should look for a tool that allows for easy integration, no matter how much information you want to include.
Advanced chart options
Advanced chart options help to perform quality analysis and extract the maximum potential from your data.

Milan Desai
Chief Technology Officer
Milan Desai has more than 20 years of industry experience in working with clients to solve business problems. Passionate about leveraging technology for improving the quality of life and optimize the use of resources. Currently, working on utilizing data to drive business decision making process and user understanding of key metrics that drive the organization and markets in general. Co-founder of EzDataMunch – the first BI Apps store in the world.

