Welcome to EzInsights for Smart Search-Driven Analytics! Get your business insight instantly. Build a beautiful dashboard and share it with anyone within or outside the organization
To get started please follow the steps
How to login
Step 1: Login
Type the URL https://ezinsights.ezdatamunch.com/in the address bar of your browser. The login page is displayed.
- Type Username and Password in the boxes.
- Click on Login Button
Upload and create application of your data and start analysis
Step 2: Create new application by connecting data
Learn how to add data to an existing or new application.
This playlist will explain how to:
- Import flat files (CSV, Excel, SQL)
- Connect to database servers
- Connect to web services
Start your Data Visualization
Step 3: Get started with data visualizations
Learn how to access and display your data in the browser interface.
This playlist will explain how to:
- Use EzInsights dashboards to explore your data
- Search your query string in a search box
- Add data visualization widgets like filters, limitations, number formatting
- Create pivot tables, charts and maps from chart panel
Filter Dashboard Data
Step 4: Apply filter option for your dashboard data
Learn how to adjust the data displayed in your dashboard by using filters.
This playlist will explain how to:
- Incorporate filters in your dashboard
- Add text filters
- Add widget filters
- Add numeric filters
- Add date filters
Selecting charts and graphs
Step 5: Select chart type from chart option for data visualization
Learn different types of charts and graphs to view insight information of your data.
The below checklist will explain the details of selecting charts and graphs:
- Click on the chart tile button
- Select your chart type according to your data
- Click apply button to view your data
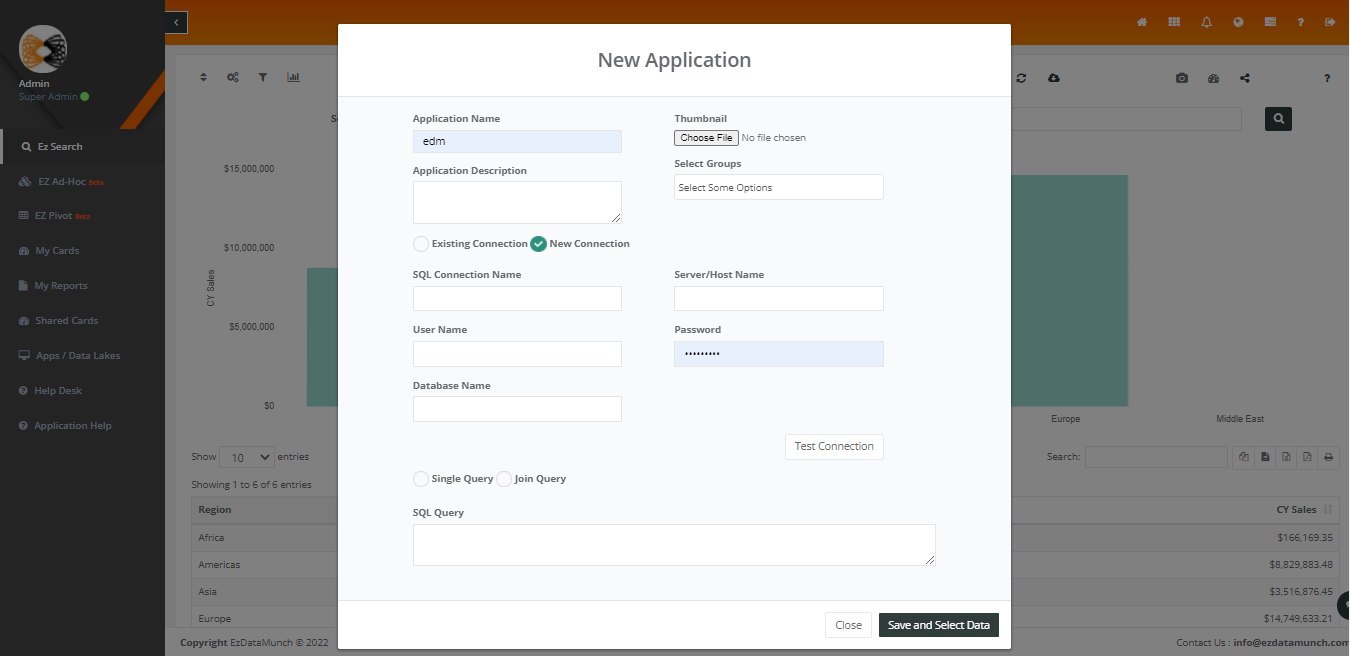
Creating new application with SQL
Step 6: Create your new application with SQL
Learn how to connect SQL server with EzInsights and create new application.
This below checklist will demonstrate:
- Create a new connection or. Use Existing for connection to SQL Server
- Use a single SQL Query with “Single Query” OR Any join or complex query with “Join Query” Which will make a View on your Database and User it for further purpose
- View the Selected Data, Change Fields Name or even Deselect the unwanted Field.
- Once Application Created! Start your EzInsights
Measures & Expression
Step 7: Build Custom Master Measures and Expression
Learn how to use custom master measure and expression.
This below checklist will demonstrate:
- Select fields from table. For making Expression.
- Giving a unique name. And selecting an aggregation for particular field and Click Insert.
- Say an Example – A Field with Sale Amount, We Need Sum of Same Amount. Can be Created by this Panel.
Manage Data
Step 8: Learn how to Create OR Update Application
This below checklist will explain how to:
- Giving a logical application name. and giving a description.
- Also, we can specify the application to a Group.
- Then after Choosing an Excel or CSV File.
- We can then View the Selected Data, Change Fields Name or even deselect the unwanted Field.
- Once Application Created! Start your EzInsights

Milan Desai
Chief Technology Officer
Milan Desai has more than 20 years of industry experience in working with clients to solve business problems. Passionate about leveraging technology for improving the quality of life and optimize the use of resources. Currently, working on utilizing data to drive business decision making process and user understanding of key metrics that drive the organization and markets in general. Co-founder of EzDataMunch – the first BI Apps store in the world.


